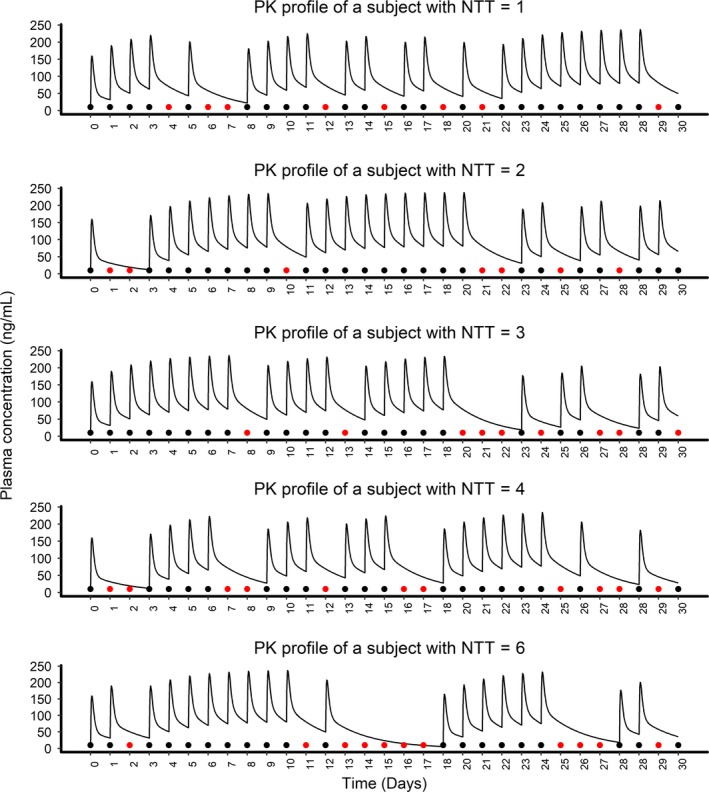
Figure 2.

The plot illustrates plasma concentration profile of five subjects for 30 days, with an average adherence of 70% and nontherapeutic times (NTTs in days) ranging from 1−6. Solid black points represent doses taken and red points represent missed doses. Two sequential missing of doses were considered as one unit of NTT. Variation in NTTs are due to the difference in adherence patterns even though all of them had an aggregate adherence rate around 70%. PK, pharmacokinetic.
