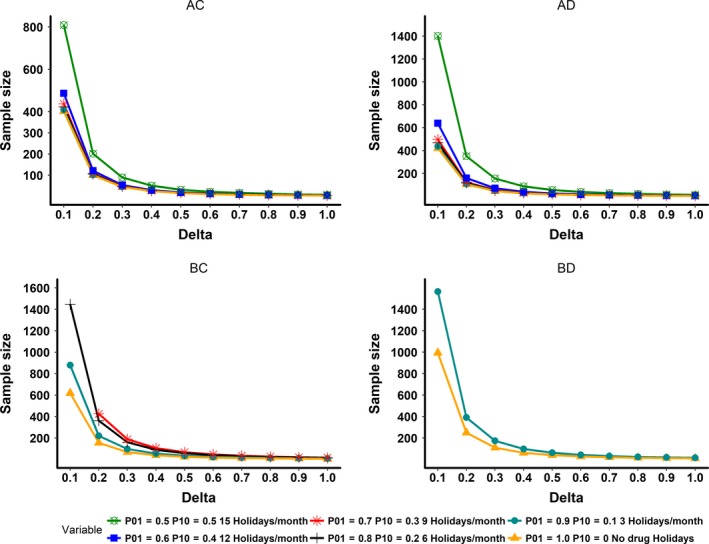
Figure 4.

This plot illustrates delta (absolute mean difference value between test and placebo) vs. sample size for all simulated pharmacokinetic/pharmacodynamic (PK/PD) characteristics. AC, long half‐life and rapid onset of PDs; AD, long half‐life and delayed onset of PDs; BC, short half‐life and rapid onset of PDs; BD, short half‐life and delayed onset of PDs. In the groups AC and AD, all adherence rates are represented. In the groups BC and BD, ineffective adherence rates, which resulted in similar mean values for the test group compared to the placebo group were dropped.
