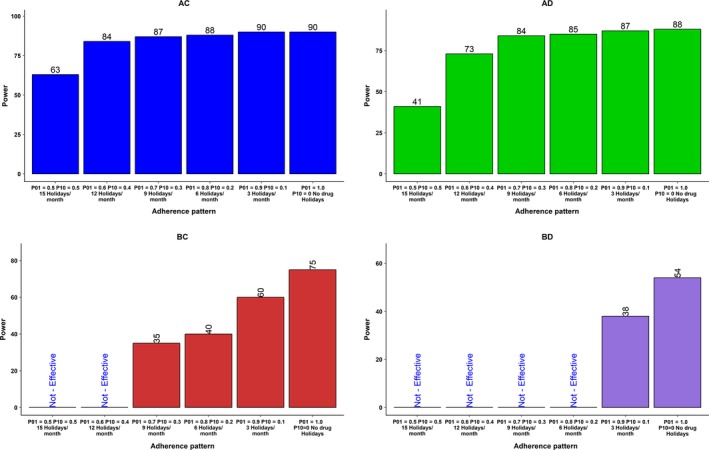
Figure 5.

Effect of adherence pattern on the power for drug characteristics AC, AD, BC, and BD at the delta level 0.2. The Markov model was used to produce various adherence patterns with average adherence rates (summarized as percentage of missed doses) from 50−100%. Specific combinations of transition probabilities (P01 and P10) produce a characteristic adherence pattern with an average adherence rate. The sum of missed doses in a month was represented as drug holidays/month for another perspective on adherence pattern. For example, the median drug holidays per month for 50% adherence group were 15. Holidays/month reduced as adherence rate increased. AC, long half‐life and rapid onset of pharmacodynamics (PDs); AD, long half‐life and delayed onset of PDs; BC, short half‐life and rapid onset of PD; BD, short half‐life and delayed onset of PDs. In the groups labeled as “Not‐Effective,” the mean value of the test drug overlapped with the mean values of the placebo group. Because the clinical simulation scenarios are with a drug that is active, not effective would represent a type II error, incorrectly retaining a false null hypothesis (also known as a “false‐negative” finding).
