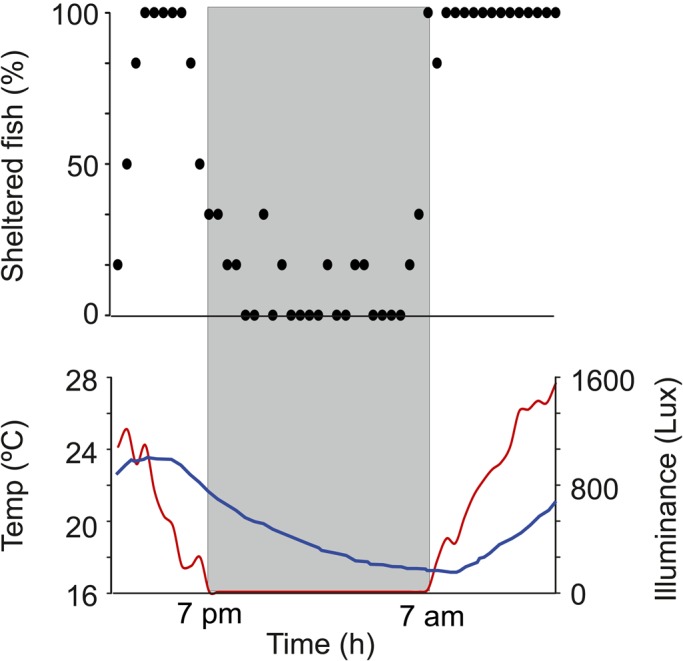
Fig. 1.

Daily changes in sheltering behavior. (Upper panel) Percentage of sheltered fish through a 24 h period. Each black dot accounts for the percentage of isolated fish (n=6) found in one of the 12 available shelters each 30 min. (Lower panel) Red line shows mean light intensity under the water. Blue line shows mean water temperature. Mean values from the six consecutive days of recording. Gray shadow signals the dark period (19:00 h–07:00 h).
