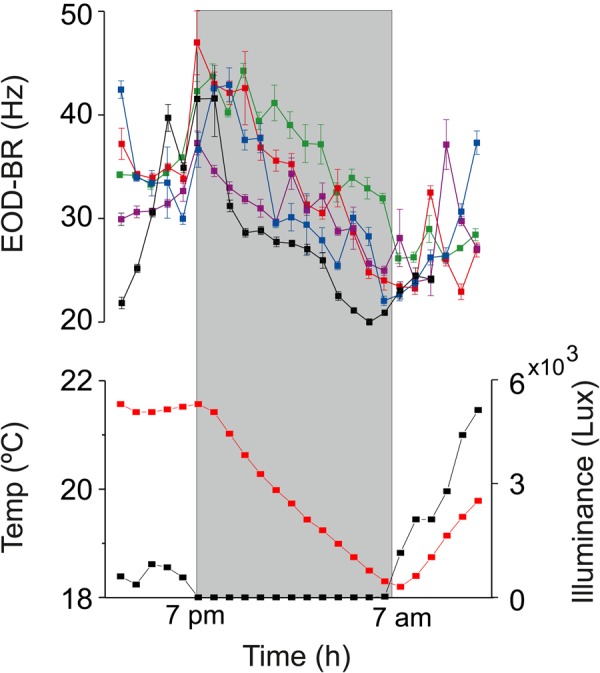
Fig. 2.

24 h recordings of EOD-BR of isolated animals (n=5) in a semi-natural setup. (Upper panel) Fish were recorded each hour only when motionless (EOD-BR values represent the median for±MAD). Each line in the upper panel shows EOD-BR for a single fish. (Lower panel) Water temperature (black) and light intensity (red). Gray shadow signals the dark period (19:00 h–07:00 h).
