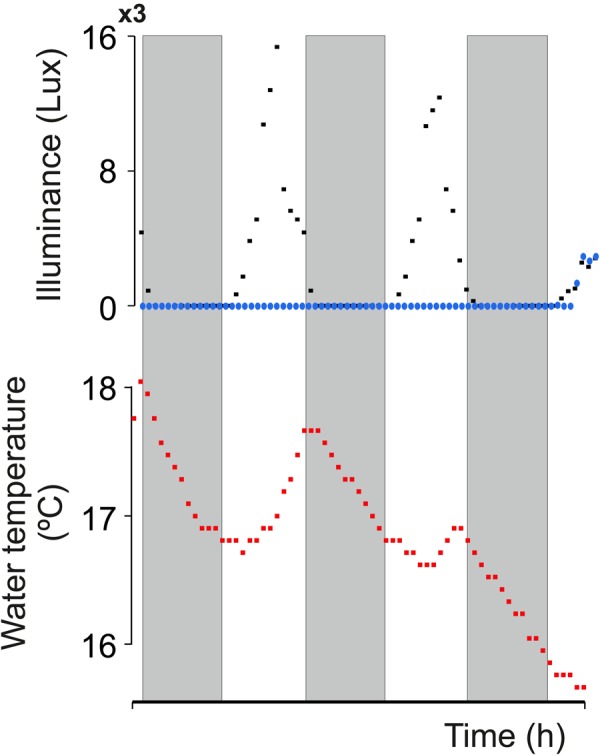
Fig. 3.

Light and temperature recordings during 72 h in the natural habitat. (Upper panel) Light intensity outside (black squares) and inside the water (blue circles). (Lower panel) Water temperature. Gray shadows signal the three dark periods (19:00 h–07:00 h).
