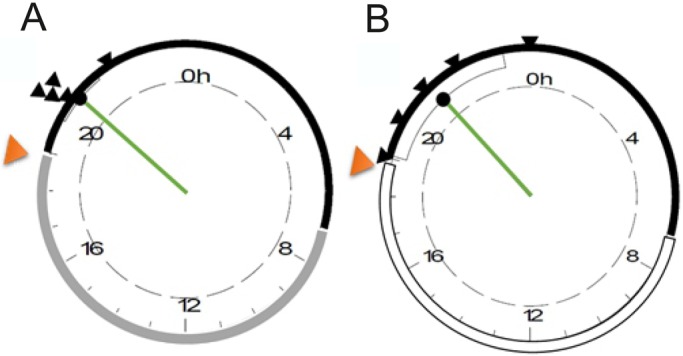
Fig. 5.

Daily rhythms in populations recorded in natural and semi-natural settings. Rayleigh test for fish recorded (A) in the natural (n=5), and (B) the semi-natural conditions (n=5). Black arrowheads indicate each individual's acrophase, orange arrowheads signal the time of maximum water temperature. Green line shows mean population acrophase and its length represents the Rayleigh radius (r). Dashed circle represents P=0.05 confidence level. Photoperiod is depicted by the outline of each circle: black, night; white, day; gray, constant darkness during daytime.
