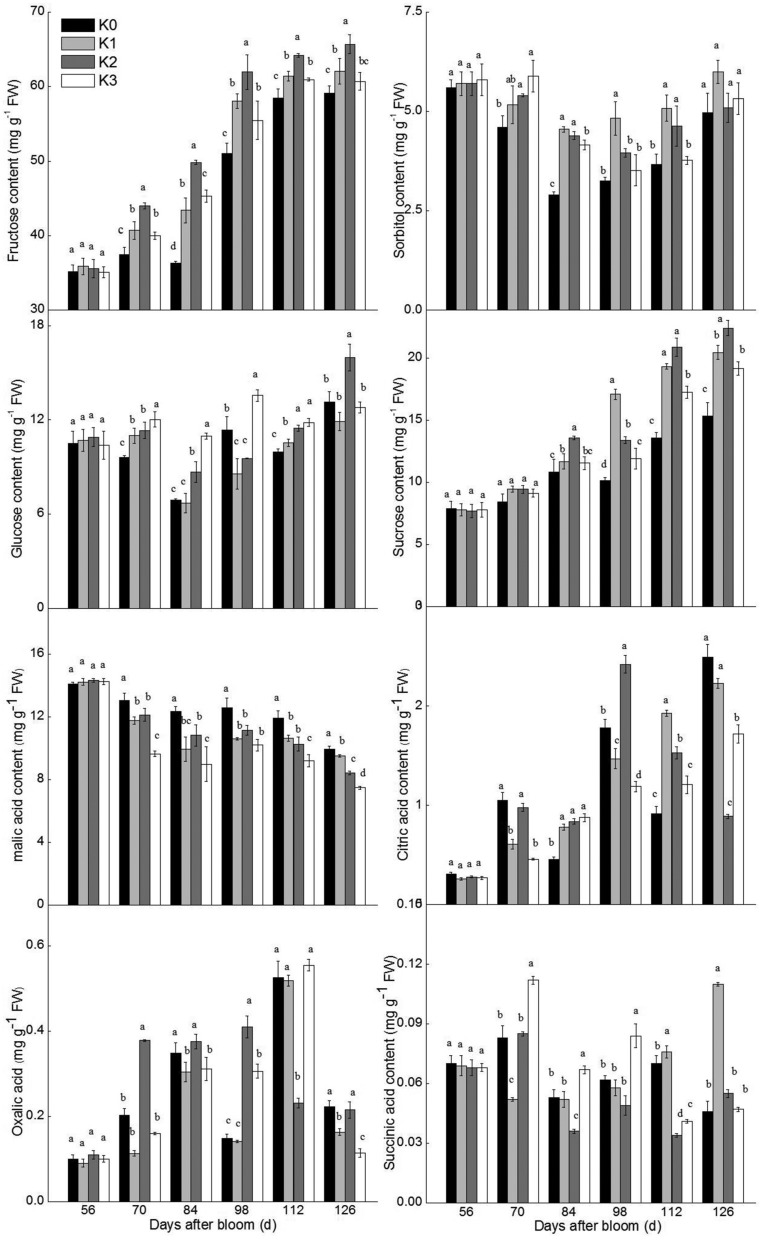
Fig. 2.
Soluble sugar and organic acid levels with different K fertilization during fruit development. The data of different K treatments were analyzed the same day after bloom. Different letters represent significant differences at P≤0.05 by Duncan's multiple range test; n=3. Results are presented as mean±s.e. in mg g−1 FW.

