Fig. 3.
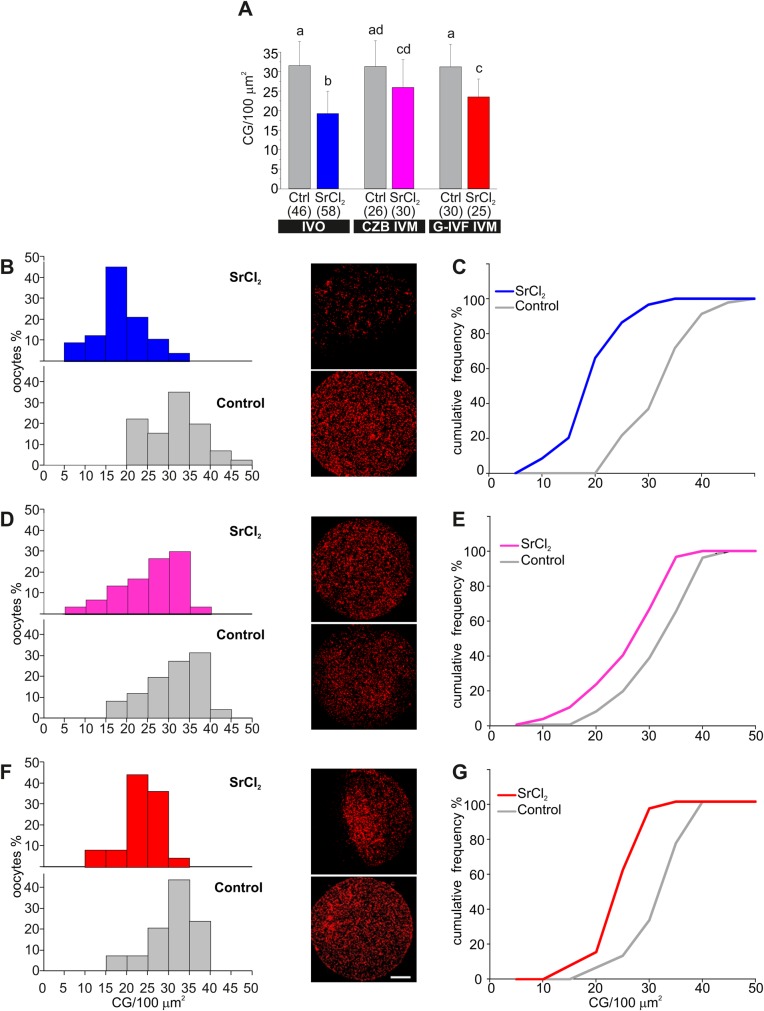
Quantification of cortical granule (CG) exocytosis in fixed oocytes. (A) Bar graph of cortical granules density (CG/100 μm2) of treated oocytes with (SrCl2) or without SrCl2 (Ctrl) for each condition: in vivo ovulated (IVO), CZB in vitro matured (CZB IVM) and G-IVF in vitro matured (G-IVF IVM) oocytes. Data are shown as mean±s.d. from at least three independent experiments; numbers in parentheses represent the total number of evaluated oocytes. Different letters indicate statistically differences between groups (P≤0.05, Steel–Dwass test). (B,D,F) Relative frequency histograms of cortical granule density for the same oocytes analyzed in A. Representative confocal images of oocytes subjected to each treatment are shown on the right. Cortical granules were labeled with LCA-rhodamine. Scale bar: 20 μm. (C,E,G) Cumulative relative frequency of cortical granule density for the same oocytes analyzed in A.

