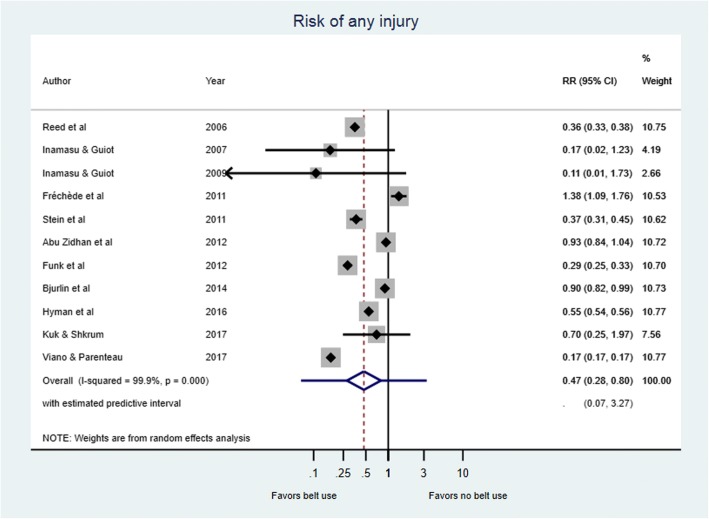
Fig. 2.
Risk of any injury in belt versus non-belt users. On the forest plots, black diamonds represent individual risk of injury (by study); Blue diamonds represent the subtotal of risk of injury by subcategory; Black lines represent the individual 95% confidence intervals; Blue lines represent the estimated predictive intervals; Blue dotted lines represent the inestimable predictive intervals

