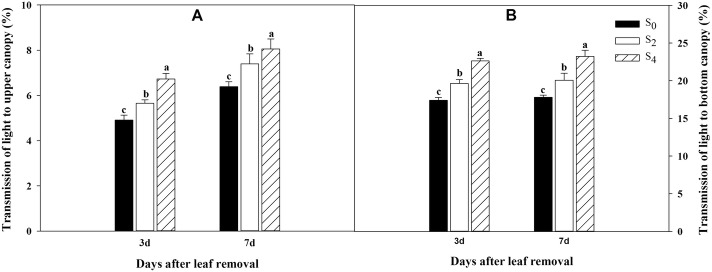
Fig. 1.
Canopy light transmission at the bottom canopy (a) and the middle canopy (b) in response to different levels of leaf removal at three and seven days after defoliation. S0 refers to control (no leaf removal); S2 and S4 refer to the removal of two or four leaves, respectively, from top of the plant. Bars indicate ± standard error of the mean (n = 3). Different small letters in each group indicate significant differences at P ≤ 0.05

