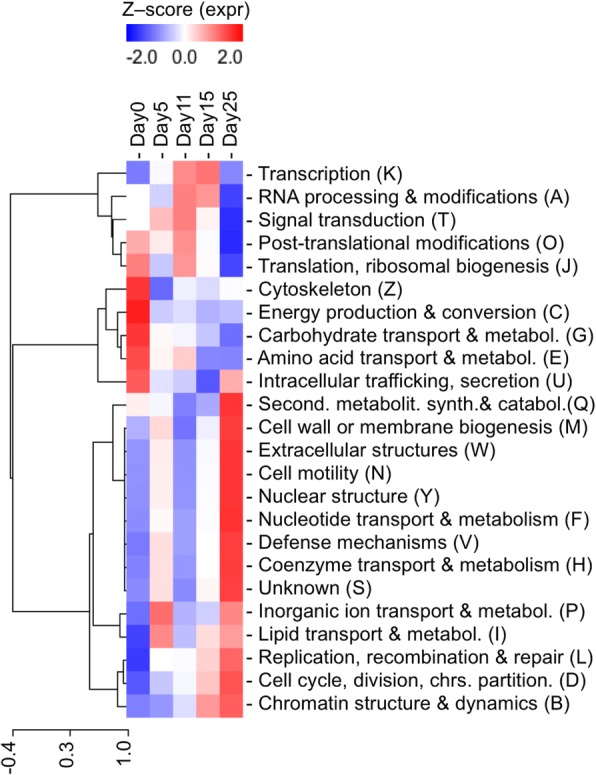
Fig. 2.

Heatmap of the eggNOG functional categories expressed throughout P. pinaster embryo developmental stages. The heatmap was built after the counts of each transcript belonging to a protein group in such category were added up, and later transformed in Z-scores. The capital letters in between brackets originate in the eggNOGs database and are specific to the functional categories. The hierarchical clustering on the left side of the image represents the correlation of the expression levels associated with distinct functional categories
