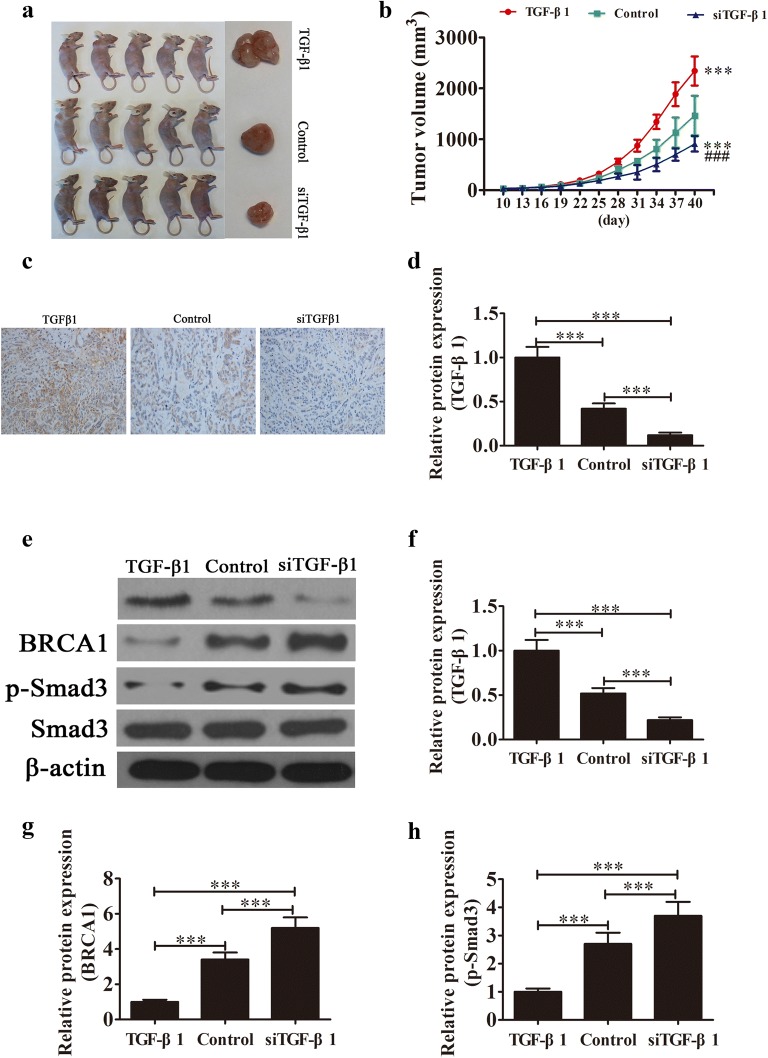
Fig. 3.
TGF-β1 downregulation suppressed tumor growth of ovarian cancer in a xenograft model. a Photographs of tumor tissues from different groups at day 40 (n = 5). b Growth curves for tumor volumes in xenografts of nude mice were determined based on the tumor volume measured every 3 days from the tenth day for 40 days (n = 5). ***P < 0.001 versus the control group. ###P < 0.001 versus the TGF-β1 overexpression group. c, d Immunohistochemical analysis showing the expression of TGF-β1 in tumor tissues. Data are expressed as the mean ± SD. e–h Western blot showing the expression of TGF-β1, BRCA1, Smad3 and phosphorylated Smad3. Data are expressed as the mean ± SD. ***P < 0.001

