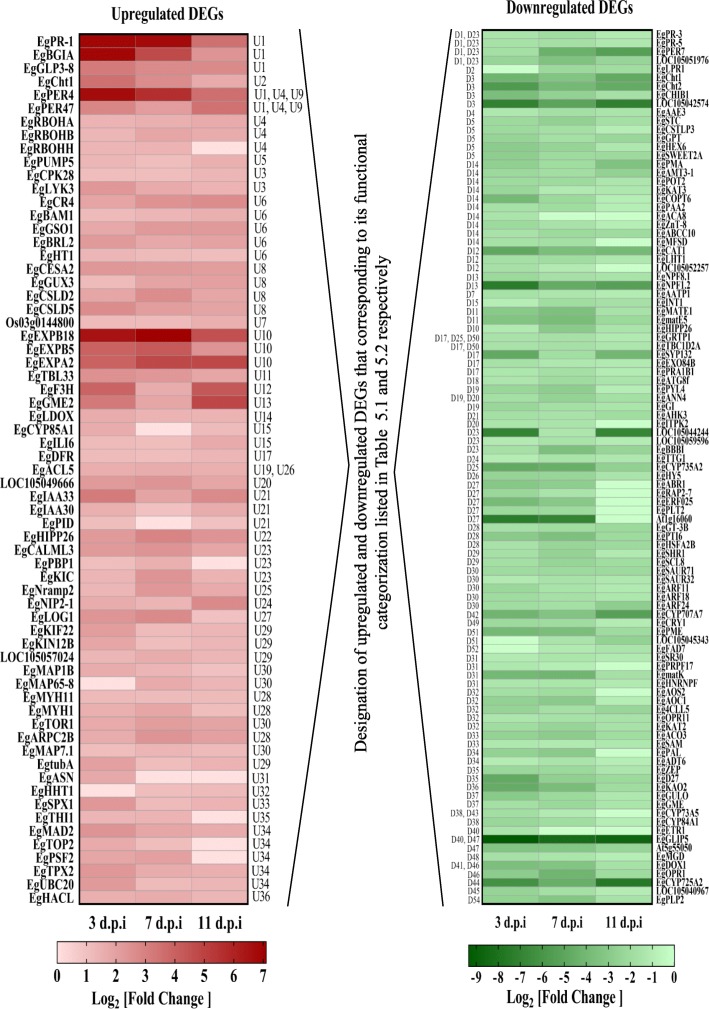
Fig. 8.
Expression pattern of selected upregulated and downregulated differentially-expressed genes (DEGs) of enriched GO terms. The colour intensity of each gene is based on Log2 [fold change] values of DEGs in T1 samples of oil palm roots during early interaction (3, 7, and 11 d.p.i) with Ganoderma boninense compared to untreated control

