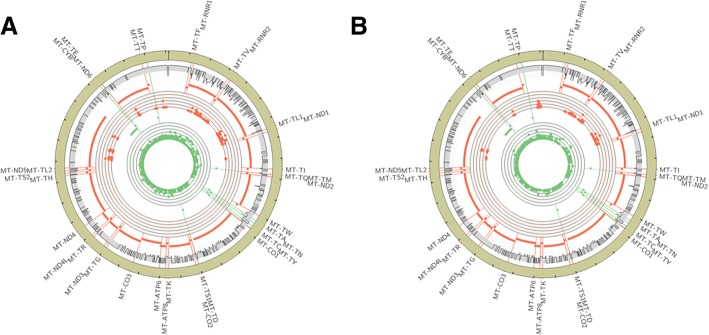
Fig. 2.
Circos plot [33] showing the locations of methylated cytosines in mtDNA from 5 normal colon mucosa (a) and 4 adenoma (b) samples. Inner scatter plot tracks indicate methylation for all sites with > = 5 total reads per locus (axis ranges from 0 to 50%; axis gridlines indicate increments of 10%) and all genes for the minus/light strand (green dots), and plus/heavy strand (red dots). The outer (grey) track indicates uniqueness of 35 bp windows, with axis lines indicating increments of 0.25, from 0 (less unique; inner) to 1 (more unique; outer) where axis values between 0.5 and 1 are shaded in grey. The transcription start site of each gene is indicated with a radial line, and the name of each gene is listed around the outside of the chromosome. 500 nucleotide increments within the chromosome (beige outer track) are indicated with tick marks

