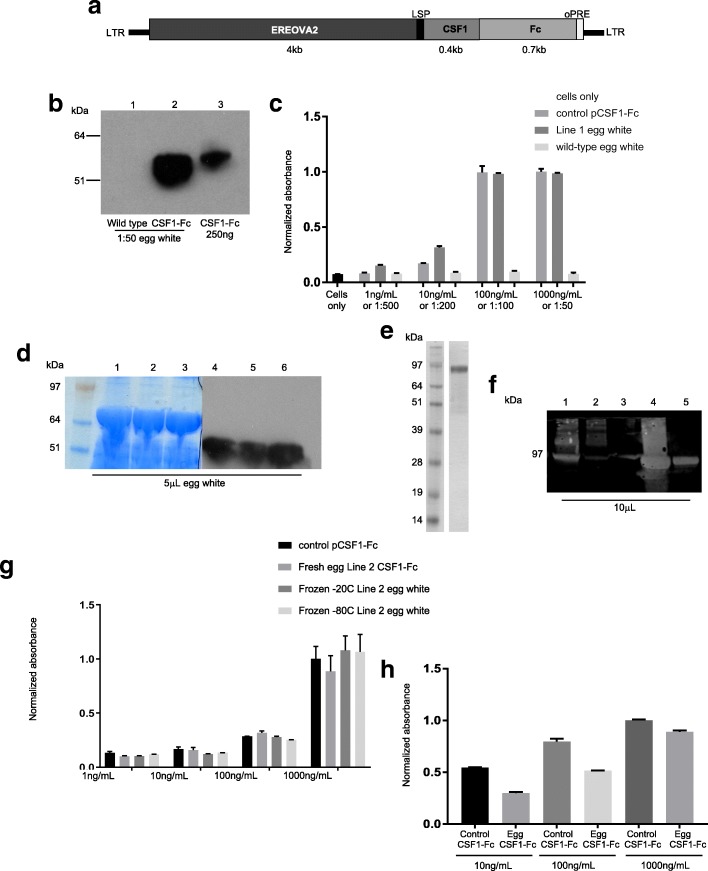
Fig. 2.
Expression of biologically-active porcine CSF1-Fc by transgenic hens. a Schematic representation of the pCSF1-Fc transgene, with HIV LTRs; a modified ovalbumin promoter containing the ERE and SDRE; LSP for secretion; the coding sequence of porcine CSF1; the coding sequence of porcine Fc; oPRE. b Egg white from wild type and transgenic hens were homogenized and diluted 1:50 in PBS (lanes 1 and 2) and separated under reducing conditions by SDS-PAGE with CHO-cell produced pure protein (lane 3) and transferred to nitrocellulose membrane and stained with anti-porcine Fc to confirm expression. c Activity of whole egg white was tested with a MTT cell survival assay. Whole egg white from transgenic hens was compared with wild type egg white with four concentrations of control protein added, while wild type egg white was used as a negative control. Measurements were taken in triplicate. Graph shows mean + SEM. d SDS-PAGE and western blot of 5 μL samples of egg white before ovomucin precipitation (lanes 1 and 4), supernatant after first centrifugation (lanes 2 and 5), and supernatant after pH adjustment and second centrifugation (lanes 3 and 6). e pCSF1-Fc dimer was purified from egg white as confirmed by non-reducing SDS-PAGE stained with Instant Blue. f Western blot of 10 μL samples from each stage of purification: MabSelect SuRe load (lane 1), MabSelect SuRe flow-through (lane 2), MabSelect SuRe wash (lane 3), MabSelect SuRe eluate (lane 4) and final pure protein (lane 5). g Activity of purified pCSF1-Fc from fresh egg white, egg white that had been frozen at -20 °C and -80 °C for at least 1 month before purification, and CHO-cell produced pCSF1-Fc was tested in a MTT Ba/F3-CSF1R cell-survival assay. Measurements were taken in triplicate. Graph shows mean + SEM. h Bone marrow from pigs was cultured in CHO-cell-produced pCSF1-Fc, pCSF1-Fc or without growth factor (cells only) for 7 days. MTT was used to assess cell viability. Measurements were taken in triplicate. Graph shows mean + SEM

