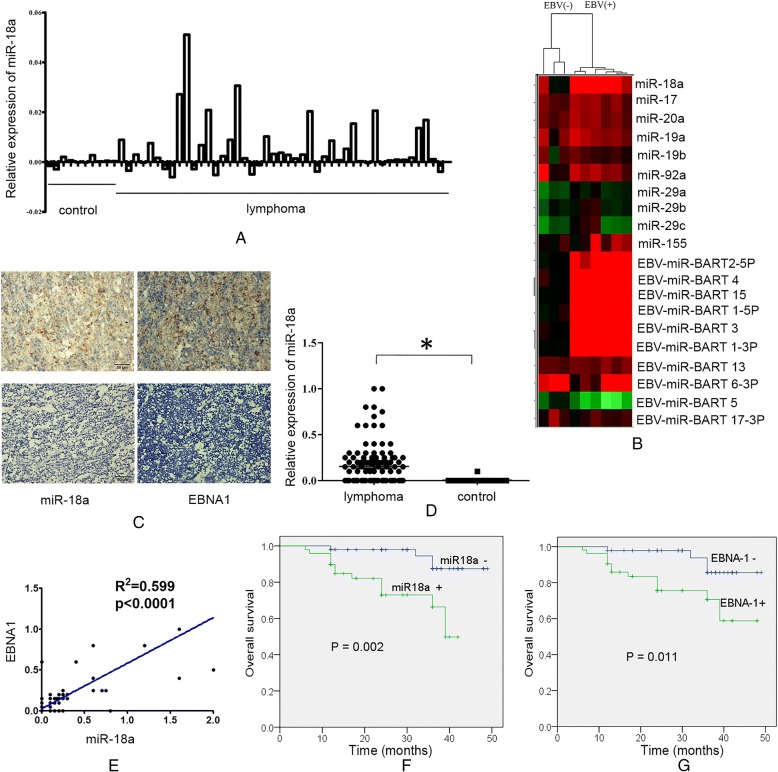
Fig. 1.
Expression of miR-18a in lymphoma patients. a Relative expression of miR-18a in diffuse large B-cell lymphoma patients and normal controls; publicly available microRNA array data (GSE42906) were compared between groups with GEO2R. b Unsupervised hierarchical clustering of microRNA expression. The miR-17-92 cluster and EBV-encoded microRNAs were differentially expressed between EBV- positive and -negative B cells; High and low expression levels are indicated by red and green, respectively. The raw data are shown in NCBI, GEO:GSE36926. c Expression of miR-18a and EBNA1. The expression of miR-18a was measured by in situ hybridization. The expression of EBNA1 was measured by immunohistochemistry. Representative figures are shown (× 100); Upper left and upper right: lymphoma biopsies; lower left and lower right: normal control lymph nodes. d Scatter plot of the observed expression scores of miR-18a. Expression was scored semi-quantitatively by multiplying the intensity and area of staining. e Correlation of the expression of EBNA1 and miR-18a. f Kaplan-Meier curves for patients according to the tumor expression of miR-18a. g Kaplan-Meier curves for patients according to the tumor expression of EBNA1

