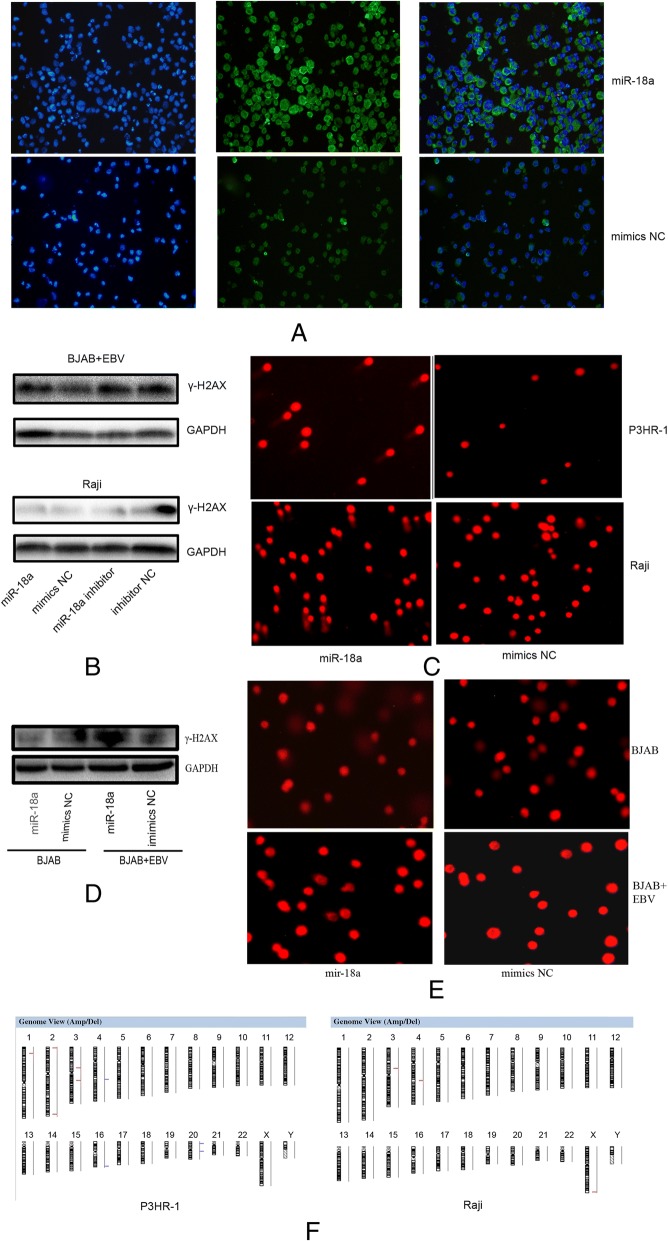
Fig. 7.
miR-18a induces DNA damage. a Expression of γ-H2AX as measured by immunofluorescence in Raji cells; EBV-positive Raji cells were stained with anti-γ-H2AX and DAPI. Expression of γ-H2AX is indicated as green loci. DAPI was used to stain the cell nuclei. The merge images present the DAPI and FITC as blue and green, respectively. b Expression of γ-H2AX as measured by western blotting in EBV-positive or -negative cells. c Detection of DNA damage after transfection of miR-18a. The comet assay was applied. Cells were electrophoresed in agarose gels on a coverslip and were stained with propidium iodide. Labeled DNA was visualized under a fluorescence microscope. d Detection of DNA damage after transfection of miR-18a in EBV-negative and -positive BJAB cells. Magnification, × 100. e Graphic presentation of all chromosomal changes. Cells transfected with miR-18a and mimics negative control were analyzed by comparative genomic hybridization array (Array-CGH). The regions of DNA gain (blue) and loss (red) are shown

