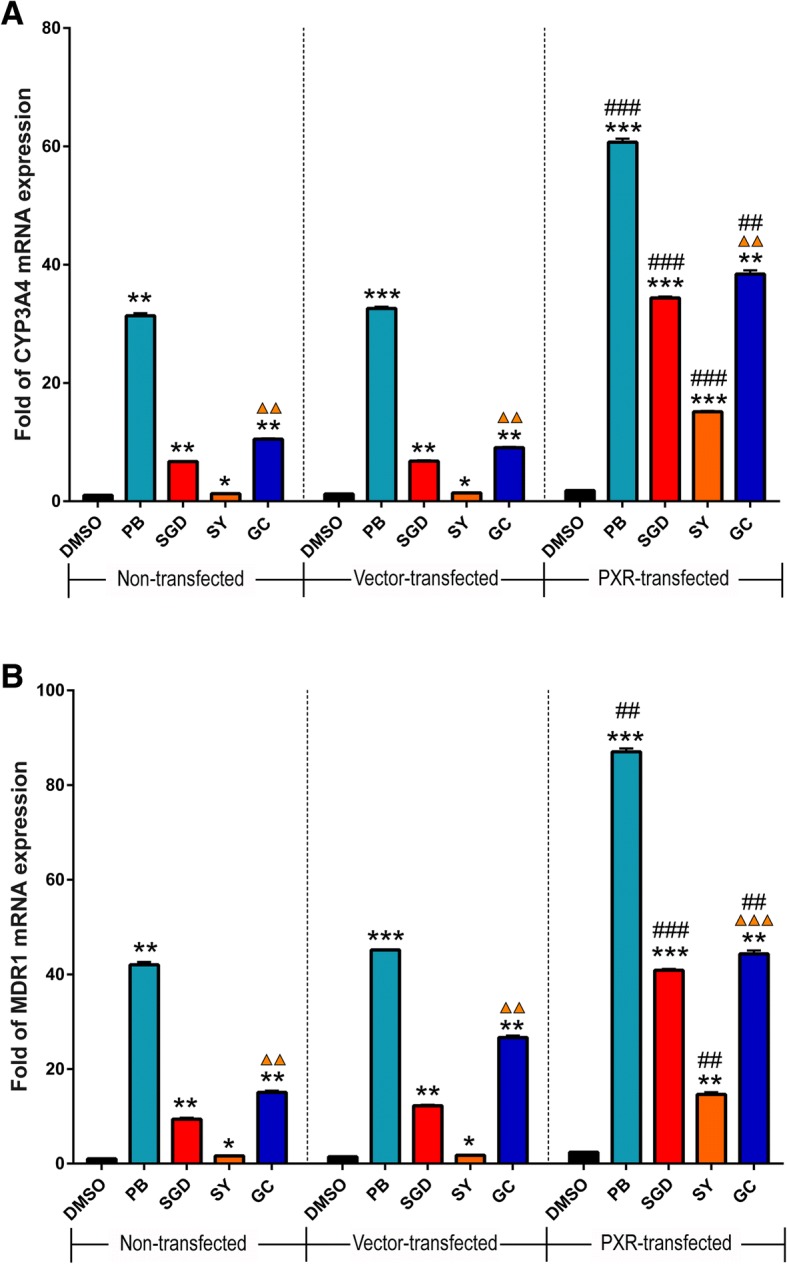
Fig. 5.

The up-regulation of phenobarbital (PB), SGD, SY, GC on CYP3A4 (a) and MDR1 (b) mRNA expression. LS174T cells were transfected with 400 ng/well pcDNA3.1-PXR, or pcDNA3.1 vector, or weren’t transfected. Cells were then exposed to phenobarbital (1 mM), or SGD (1 mg/ml), or SY (1 mg/ml), or GC (1 mg/ml) for 48 h. mRNA expression of CYP3A4 and MDR1 was determined using real-time qPCR. Data are presented as -fold increase to non-transfected group with DMSO treatment. Data are presented as means ± S.E.M of three independent experiments performed in triplicates. Statistical significance was determined by one-way ANOVA with Welch correction, followed by the Games Howell test. One-way ANOVA with Welch’s correction revealed significant differences among the groups (Welch’s p < 0.001). *p < 0.05, **p < 0.01, ***p < 0.001 compared to the DMSO group with the same transfection; ▲▲p < 0.01, ▲▲▲p < 0.001 represents GC group compared to SY group with the same transfection; ##p < 0.01, ###p < 0.001 compared to vector-transfected group with the same drug treatment
