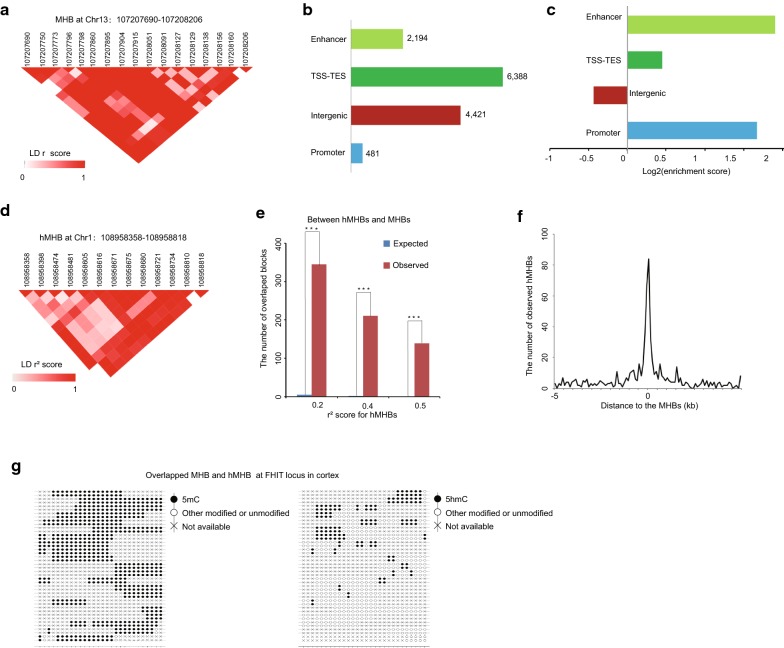
Fig. 2.
Characterization of the methylation haplotype blocks (MHBs) and tissue clustering based on methylation haplotype load. a An example of a MHB at the gene body of the gene at chromosome 13. The LD r2 scores between the CpG sites in the MHB were represented in heatmap. The scale bar from white to red represents the LD r2 scores between the two CpG sites from low to high. b Co-localization of MHBs (n = 10,809) with known genomic elements. c Enrichment of MHBs in known genomic features. d An example of a hMHB at Chromosome 1. The LD r2 scores between the CpG sites in the MHB were represented in heatmap. The scale bar from white to red represents the LD r2 scores between the two CpG sites from low to high. e The overlap between the hydroxymethylation haplotype blocks (hMHBs) and MHBs in gene body regions. The expected number of overlapped blocks was evaluated by random sampling method. The coordination was measured under different cutoffs for the LD r2 score of linkage disequilibrium two adjacent CpG sites hydroxymethylation. P values were calculated by hypergeometric test. ***Represents p value < 0.0001. f The observed number of the segment middle for hMHBs within 5 k of the segment middle for MHBs within gene body regions. The number for the segment middle for hMHBs was evaluated in the 100 bp bin. g Lollipop plots showing the 5mC and 5hmC modification of neighboring CpGs of a DNA molecule at FHIT locus, overlapped MHB and hMHB

