Fig. 6.

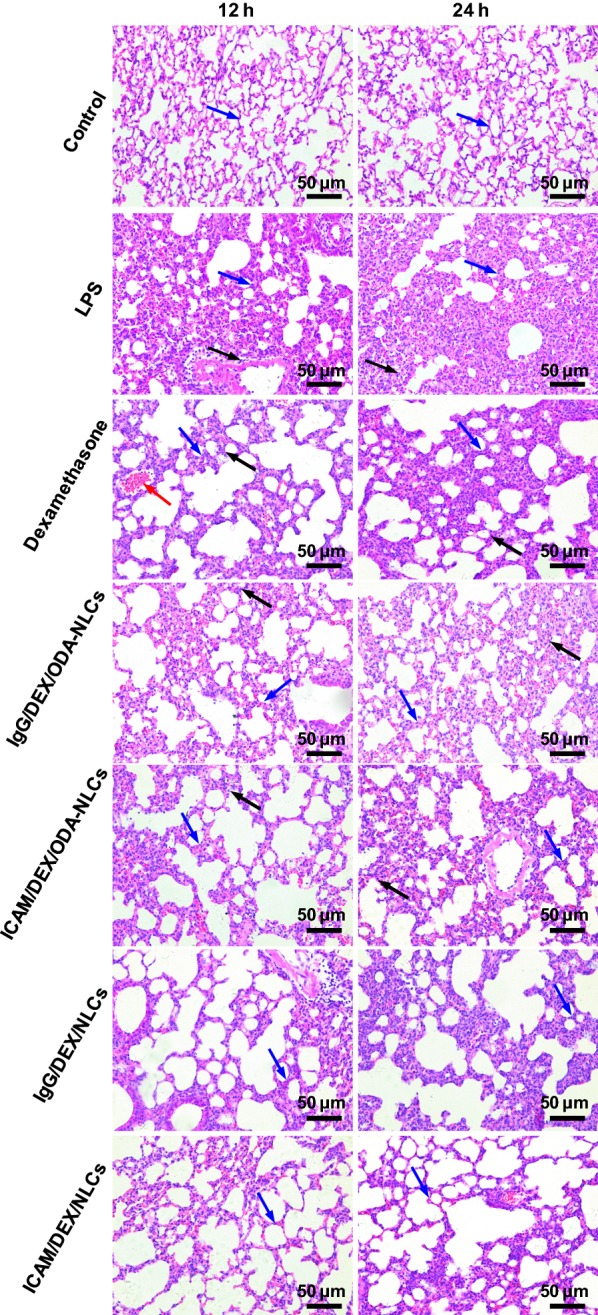
The pulmonary histopathological examination by H&E stain. The black arrows depict the neutrophils infiltration. The red arrows indicate the alveolar wall hyperemia. The blue arrows indicate the alveolar wall (bar = 50 μm)

The pulmonary histopathological examination by H&E stain. The black arrows depict the neutrophils infiltration. The red arrows indicate the alveolar wall hyperemia. The blue arrows indicate the alveolar wall (bar = 50 μm)