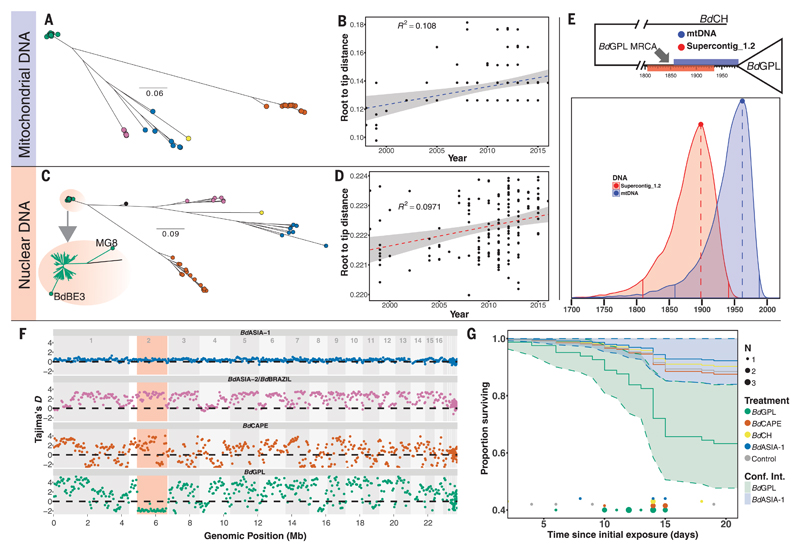
Fig. 2. Dating the emergence of BdGPL.
(A) Maximum likelihood (ML) tree constructed from 1150 high-quality SNPs found within the 178-kbp mitochondrial genome. (B) Linear regression of root-to-tip distance against year of isolation for BdGPL isolates in mitochondrial DNA phylogeny in (A), showing a significant temporal trend (F = 14.35, P = 0.00024). (C) ML tree constructed from a 1.66-Mbp region of low recombination in Supercontig_1.2. Two BdGPL isolates, BdBE3 and MG8, fall on long branches away from the rest of the BdGPL isolates (see inset zoom) as a result of introgression from another lineage (BdCAPE; see Fig. 3B) and were excluded from the dating analysis. (D) Linear regression of root-to-tip distance against year of isolation for BdGPL isolates from phylogeny in (C), with a significant temporal trend (F = 15.92, P = 0.0001). (E) Top: BdGPL and outgroup BdCH, with the 95% HPD estimates for MRCA for BdGPL from mtDNA dating (blue) and nuclear DNA dating (red). Bottom: Full posterior distributions from tip-dating models for mtDNA (blue) and partial nuclear DNA (red) genomes. Solid vertical lines are limits of the 95% HPD. Dashed vertical lines denote the maximal density of the posterior distributions. (F) Sliding 10-kb, nonoverlapping window estimates of Tajima’s D for each of the main B. dendrobatidis lineages. The region highlighted in red is the low-recombination segment of Supercontig_1.2. (G) Survival curves for Bufo bufo metamorphs for different B. dendrobatidis treatment groups: BdASIA-1 (blue), BdCAPE (orange), BdCH (yellow), BdGPL (green), and control (gray). Confidence intervals are shown for BdGPL and BdASIA-1, showing no overlap by the end of the experiment. Instances of mortalities in each treatment group are plotted along the x axis, with points scaled by number of mortalities at each interval (day).

