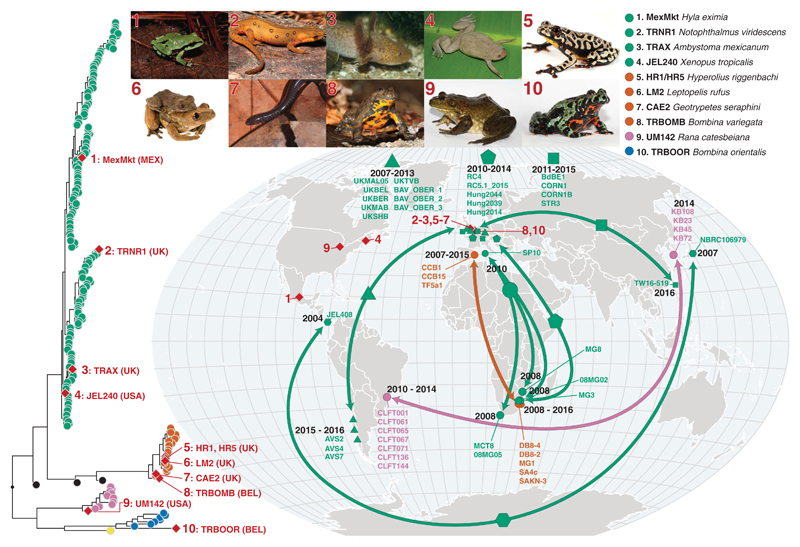
Fig. 4. Genotypes of Bd isolated from infected amphibians in the international trade and phylogenetically linked genotypes from segregated geographic localities.
The red diamonds on the phylogeny indicate isolates recovered from traded animals. Their geographic location is displayed by the red diamonds on the map. The red numbers link each trade isolate to the relevant picture of the donor host species atop the figure and their placement in the phylogeny. The arrows on the map link geographically separated isolates that form closely related phylogenetic clades with high bootstrap support (≥90%). Each clade is denoted by a different-shaped point on the map; names of isolates within each clade are displayed on the map. The dates displayed indicate the sampling time frame for each clade. The phylogenetic position of each clade is displayed in figs. S10 to S14. The colors of points and arrows on the map indicate lineage according to Fig. 1. A browsable version of this phylogeny can be accessed at https://microreact.org/project/GlobalBd. [Photo credits: (1) Hyla eximia, Ricardo Chaparro; (2) Notophthalmus viridescens, Patrick Coin/CC-BY-SA 2.5; (3) Ambystoma mexicanum, Henk Wallays; (4) Xenopus tropicalis, Daniel Portik; (5) Hyperolius riggenbachi and (6) Leptopelis rufus, Brian Freiermuth; (7) Geotrypetes seraphini, Peter Janzen; (8) Bombina variegata, (9) Rana catesbeiana, and (10) Bombina orientalis, Frank Pasmans]

