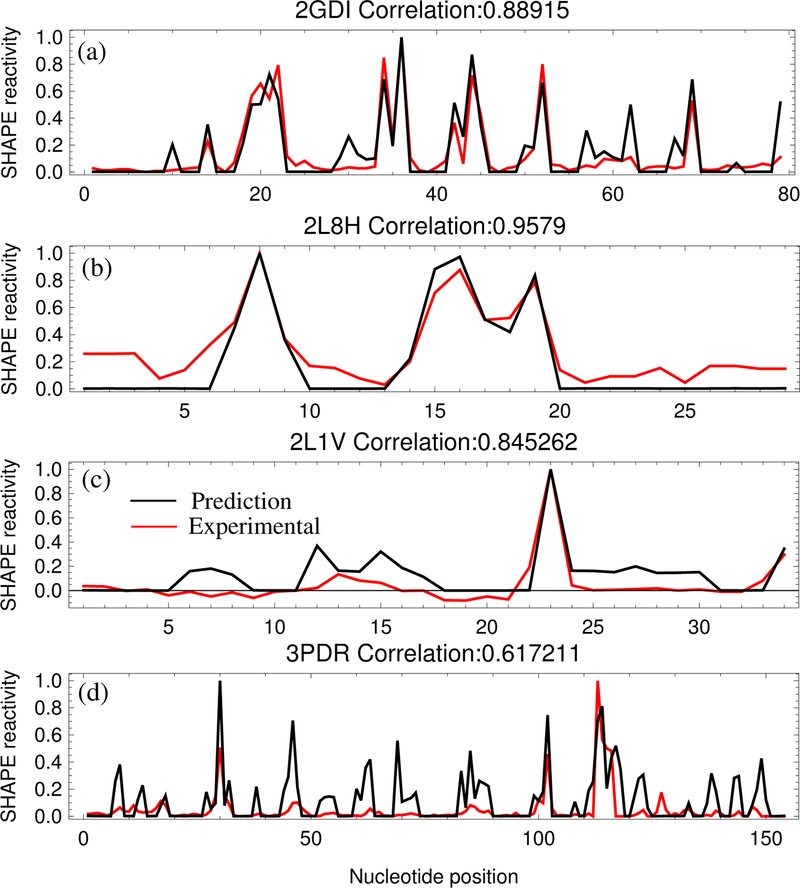
Figure 3:
(a) Comparison between the predicted (black) and the experimental (red) SHAPE profiles for the TPP riboswitch (2GDI),36 the case with the smallest p-value. (b) Comparison of SHAPE profiles for the TAR RNA (2L8H),30 the case with the highest correlation. (c) Comparison of SHAPE profiles for the (small) M-Box Riboswitch (2L1V),36 the case with the largest p-value. (d) Comparison of SHAPE profiles for the (large) M-Box Riboswitch (3PDR),36 the case with the lowest correlation.

