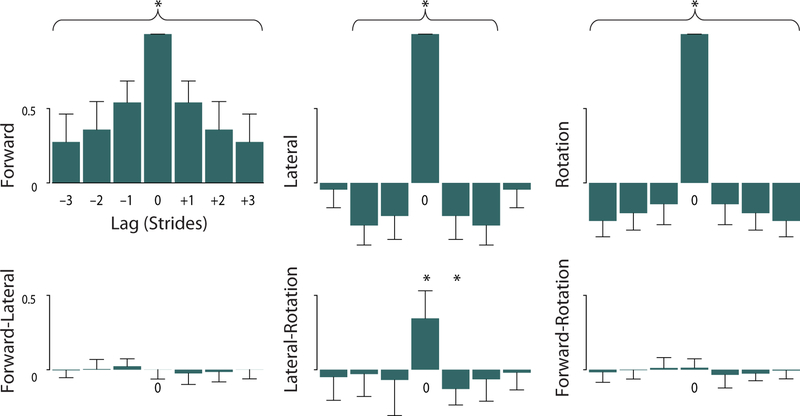
Figure 5:
Cross-correlations of stride measures across neighboring strides. All combinations of Forward, Lateral, and Rotation (about vertical) are cross-correlated with each other. These are computed with lags ranging from −3 to 3 strides, so that zero lag corresponds to covariance (Figure 4B) with diagonals normalized to unity. Bars represent mean cross-correlations across subjects (asterisks denote significant difference from zero with P < 0.01), and error bars denote standard deviations.

