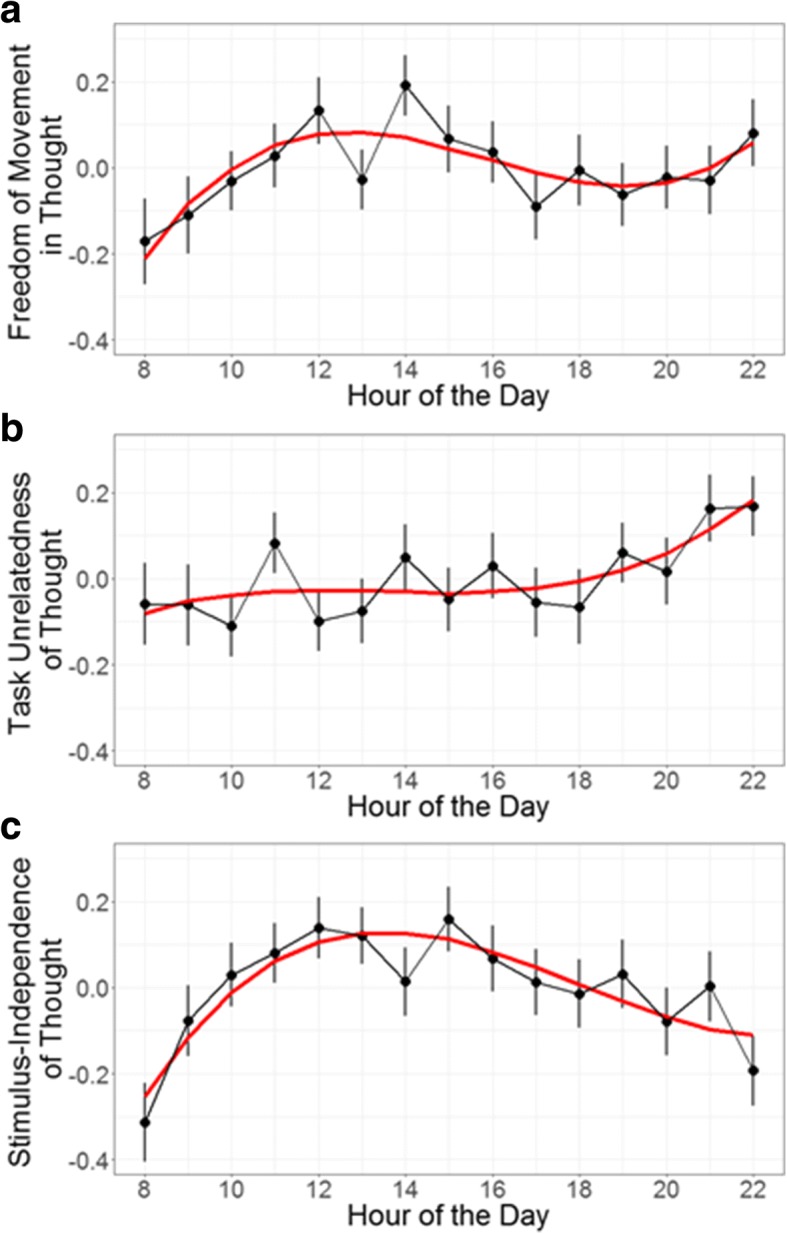
Fig. 3.

Thought dimension ratings displayed by the hour of the day. Error bars represent standard errors. Red lines represent predictions of the optimal model for each dimension (cubic in all cases): (a) freedom-of-movement in thought, (b) task-unrelatedness of thought, (c) stimulus-independence of thought
