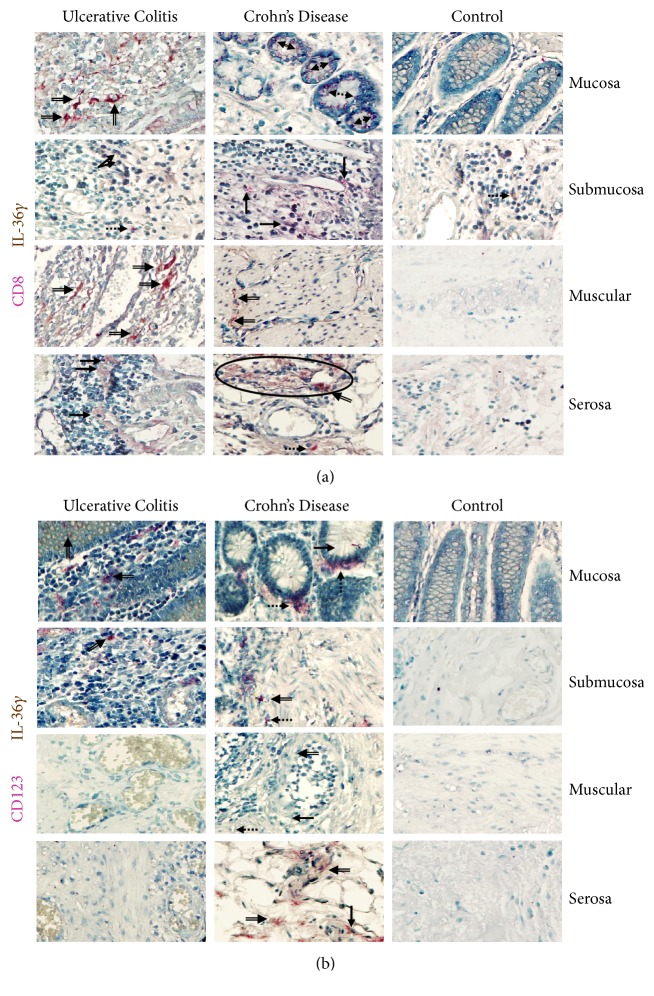
Figure 4.
IL-36 γ production in intestinal tissue from IBD patients. (a) CD8+/IL-36γ expressing cells. (b) CD123+/IL-36γ pDC. Representative immunoperoxidase in tissue from active ulcerative colitis patients (n=10; left panel), active Crohn's disease patients (n=10; middle panel), and noninflamed colonic tissue (n=10; right panel). Photomicrographs represent mucosa, submucosa, muscular, and serosa. Dotted arrows depict the cytokine expression, solid arrows show expression of cell-surface marker (leukocytes), double arrows indicate CD8α+ or CD123+ (in pink)/IL-36γ (in brown) double positive cells (burgundy), and circles highlight the immunoreactive perivascular inflammatory infiltrates. Original magnification was X320.

