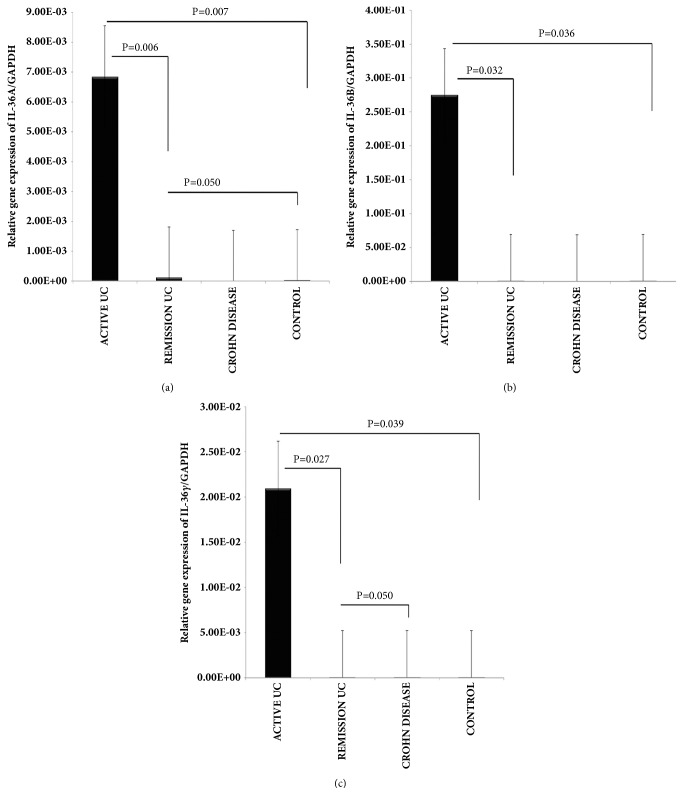
Figure 6.
IL-36 family relative gene expression quantified by RT-PCR. (a) IL-36α gene expression. (b) IL-36ß gene expression, (c) IL-36γ gene expression. RT-qPCR was performed to assess mRNA levels in colonic mucosa biopsies from IBD patients, bars show means with standard error of the mean of IL-36α, IL-36ß and IL-36γ transcript levels with GAPDH as housekeeping gene determined by 2 ∆ ∆Ct, differences among groups were assessed by Kruskall Wallis test, and p values are presented in the figure.

