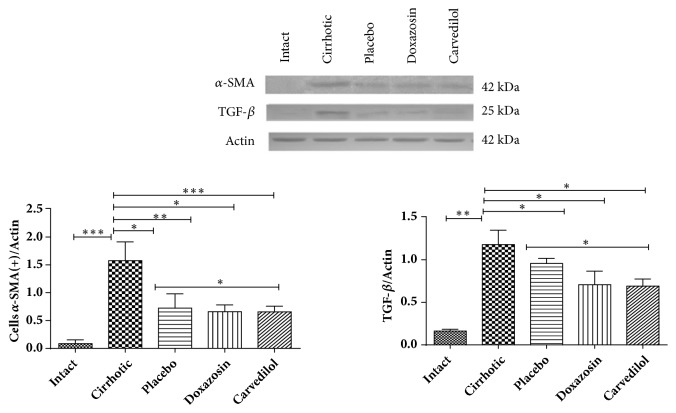
Figure 4.
Expression and quantification of α-SMA for activated hepatic stellate cells (HSCs) and TGF-β, demonstrating the antifibrotic capacity of the treatments with doxazosin and carvedilol. It was evaluated with analysis of variance test with the Tukey post hoc. Values are expressed as the mean ± SD for each of the markers of cirrhosis currently analyzed (n=3 tissue samples for each group). ∗p < 0.05 doxazosin and carvedilol versus placebo for α-SMA and TGF-β and ∗∗∗p < 0.001. Intact versus cirrhotic for α-SMA and TGF-β.

