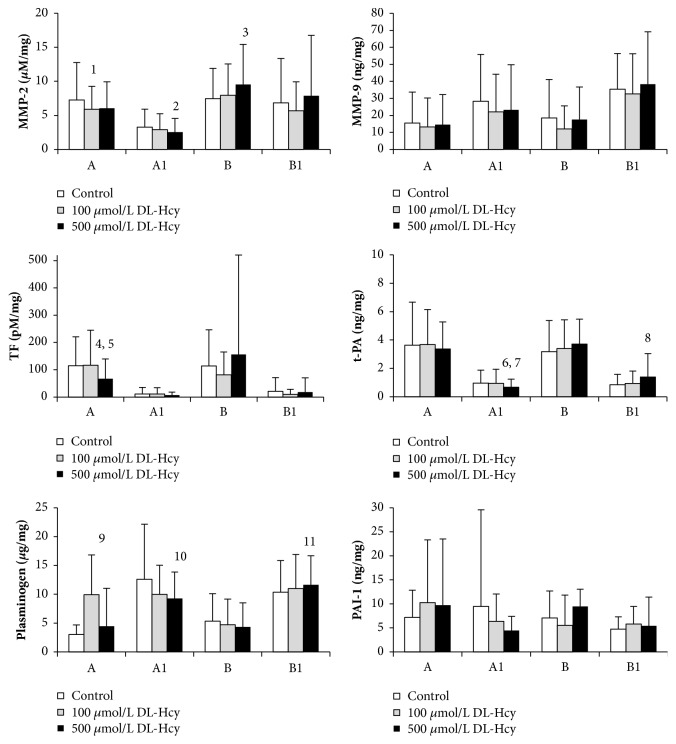
Figure 2.
The effect of DL-homocysteine (DL-Hcy) on proteolytic and haemostatic protein expression in thin (B1) and thick (A1) intraluminal thrombus and walls underlying thick (A) and thin (B) intraluminal thrombus (n=36). Sections of aneurysm tissues were incubated in the absence of DL-Hcy (control) and with 100 or 500 µmol/L DL-Hcy for 6 h. Concentrations are per mass of total protein. Bars represent standard deviations. One way ANOVA, with LSD post-hoc tests for pairwise comparisons of control sample and Hcy-treated aneurysm tissues Post-hoc LSD tests: 1, 100 μmol/L DL-Hcy vs control (p=0.046); 2, 500 μmol/L DL-Hcy vs control (p=0.006); 3, 500 μmol/L DL-Hcy vs control (p=0.011); 4, 500 μmol/L DL-Hcy vs control (p=0.007); 5, 500 μmol/L DL-Hcy vs 100 μmol/L DL-Hcy (p=0.005); 6, 500 μmol/L DL-Hcy vs control (p=0.021); 7, 500 μmol/L DL-Hcy vs 100 μmol/L DL-Hcy (p=0.031); 8, 500 μmol/L DL-Hcy vs control (p=0.024); 9, 100 μmol/L DL-Hcy vs control (p=0.004); 10, 500 μmol/L DL-Hcy vs control (p=0.017); 11, 500 μmol/L DL-Hcy vs control (p=0.018).

