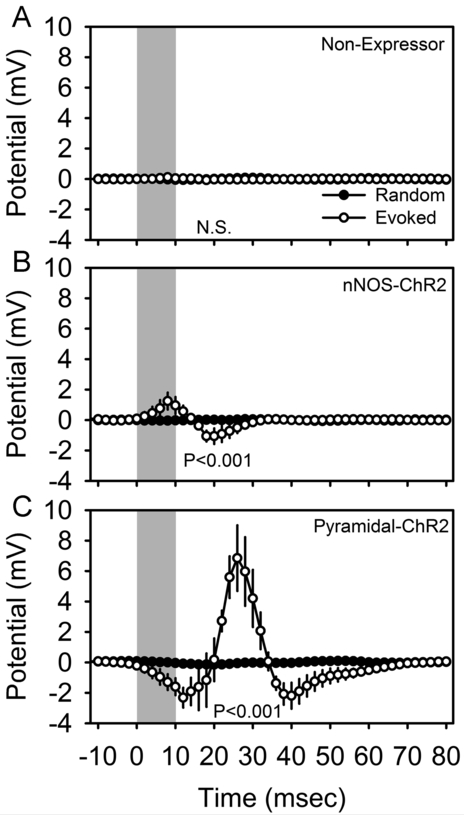
Figure 3.
Optogenetically-evoked potentials in the cerebral cortex of isoflurane anesthetized non-expressor (A; n=5), nNOS-ChR2 (B; n=4) and pyramidal-ChR2 (C; n=4) transgenic mice. Local field potentials were averaged across 4200-5000 trials per animal. Peristimulus histograms for optogenetic stimuli are shown in white and those from an equal number of randomly timed segments of data in the same recording are shown in black. Gray shading indicates the timing of 10 msec optogenetic stimulation. Data shown are grand mean of these averaged curves across subjects. P values denote main effect of time in repeated measures ANOVA.

