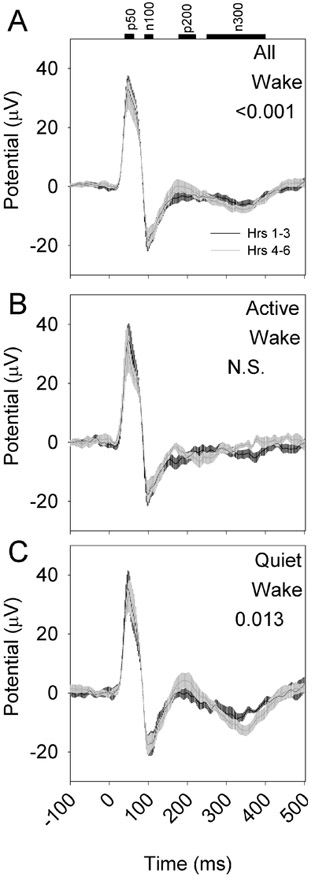
Figure 8.
Evoked responses to optogenetic activation of nNOS-positive cells vary as a function of duration of sleep deprivation (n=8 mice). A 10-msec optogenetic stimulus was applied from time 0 to time 10 msec. Black curves indicate the grand mean±SEM of averaged evoked responses during the first three hours of continuous sleep deprivation; gray curves indicate the grand mean±SEM of averaged evoked responses during hours 4-6 of continuous sleep deprivation. Data are from wake (A), active wake (B), quiet wake (C). P values denote interaction of time relative to stimulus onset and SD phase (hrs 1-3 vs hrs 4-6) in affecting EEG potential.

