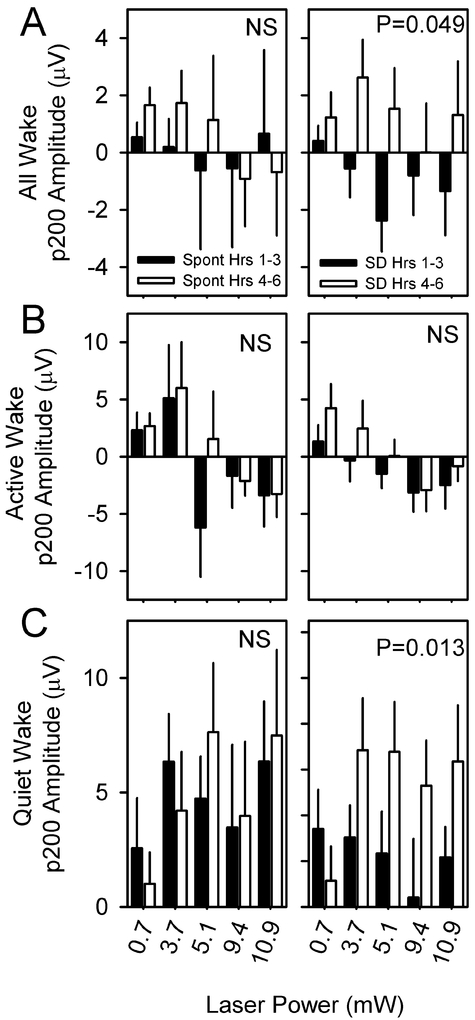
Figure 9.
p200 amplitude is potentiated by sleep deprivation. p200 values from hours 1-3 (black bars) or 4-6 (white bars) of spontaneous sleep (left panels) and sleep deprivation (right panels) are compared within states of wake (A), AW (B) or QW (C) for stimuli of four intensities. P value denotes main effect of time (hours 1-3 vs hours 4-6). Other evoked potential parameters (p50, n100, p200, n300, RMS) were unaffected by sleep deprivation.

