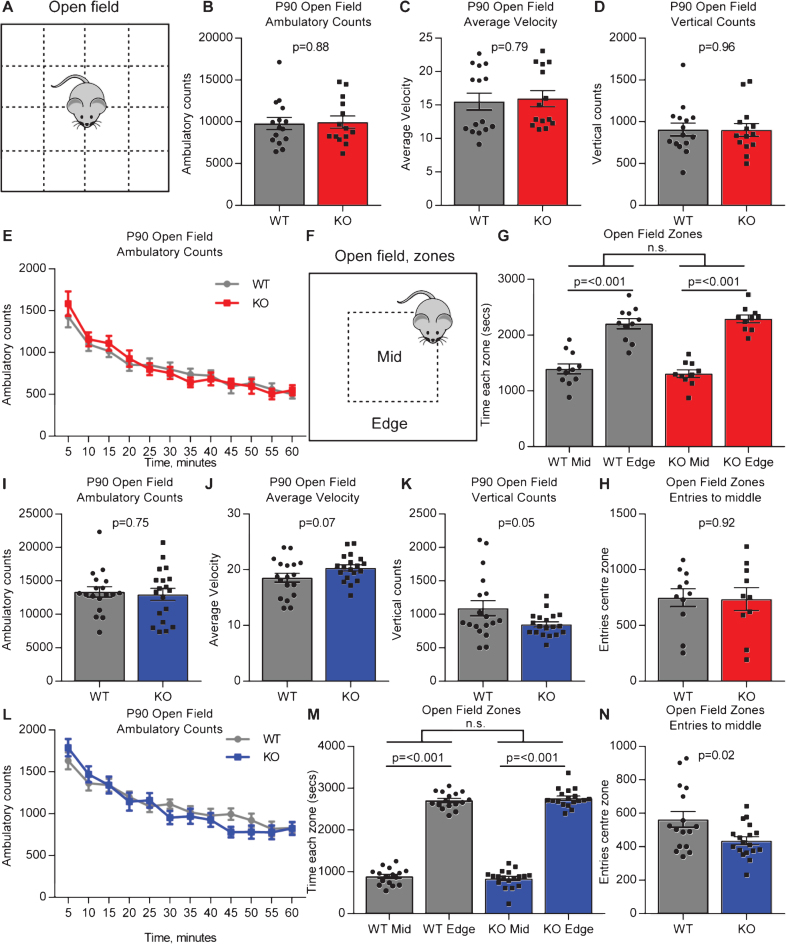
Fig.2.
Adult Gpc4 KO mice perform similar to WT in an open field. A. Schematic of the open-field chamber, dashed lines represent beams that detect movement. B-D. C57Bl6/J P90 Gpc4 KO mice show the same activity as WT over a 60 minute period, in total distance moved (B), velocity (C) and vertical counts/rearing (D). E. Ambulatory counts in 5 minute bins, no difference in movement over time between WT and Gpc4 KO. N = 15 WT, 14 Gpc4 KO, statistics by T-test (B-D), bar graph mean±s.e.m., individual points represent mice. F. Schematic of the open-field chamber with center and edge zones marked. G-H. Gpc4 KO and WT mice spend similar times to each other in the center and edge zones of the open field (G), and no difference in the number of entries to the center zone (H), showing no anxiety phenotype. N = 11 WT, 10 Gpc4 KO, statistics by 2-way ANOVA (G) or T-test (H), bar graph mean±s.e.m., individual points represent mice. I-K. FVB P90 Gpc4 KO mice show the same activity as WT over a 60 minute period, in total distance moved (I) and velocity (J), but show significantly less vertical counts/rearing (K). L. Ambulatory counts in 5 minute bins, no difference in movement over time between WT and Gpc4 KO. N = 18 WT, 19 Gpc4 KO, statistics by T-test (I-K), bar graph mean±s.e.m., individual points represent mice. M-N. Gpc4 KO and WT mice spend similar times in the center and edge zones of the open field (M), with KO mice showing significantly less entries to the center zone (N), showing a slight anxiety phenotype. N = 16 WT, 18 Gpc4 KO, statistics by 2-way ANOVA (M) or T-test (N), bar graph mean±s.e.m., individual points represent mice.

