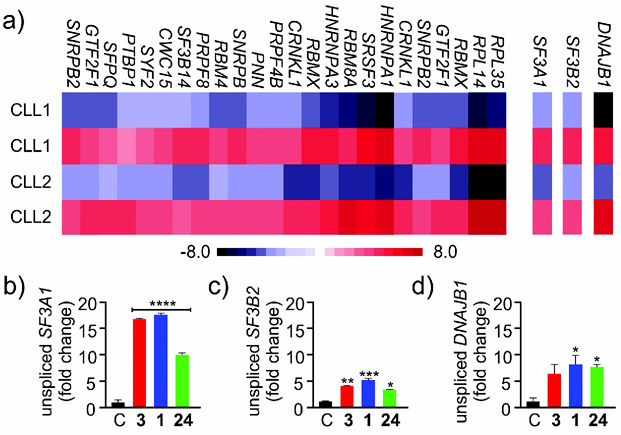
Figure 10.
a) Examples of gene selectivity identified by RNAseq analysis. b) Examples of gene selectivity identified by qRT-PCR analysis. Three selected genes (SF3A1, SF3B2, and DNAJB1) are shown as representative examples. The level of splicing in these genes was not identical for FD-895 (3), pladienolide B (1), and cyclopropane 24, as shown in (b--d), respectively.

