Figure 13.
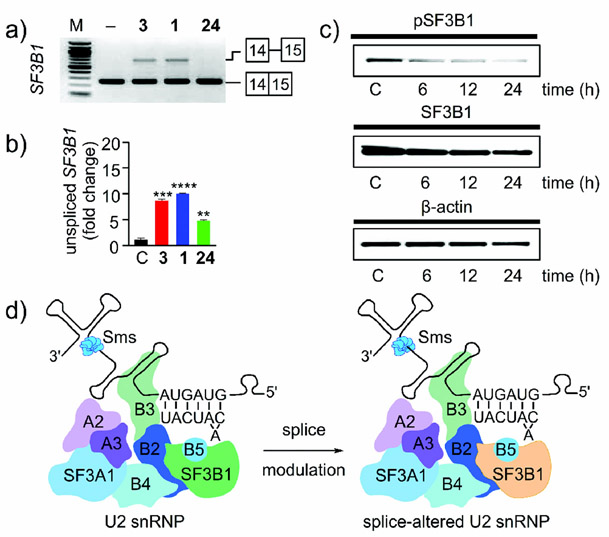
Feedback in splicing modulation. a) RT-PCR and b) qRT-PCR analysis of MCL-B cells treated with 100 nm 1, 3, or 24, or a DMSO control for 4 h. c) Pladienolide B (1) regulates the level of SF3B1 phosphorylation. JeKo-1 cells were treated with 100 nm 1 for 6 h, 12 h or 24 h. Untreated cells grown for 24 h were used as a control (C). d) Schematic representation of the feedback modulation of SF3B1. Inhibition of SF3B1 (green) results in IR in SF3B1 and leads to a reduction in the amount of SF3B1 protein (orange) within the U2 snRNP. The net effect is a reduction in SF3B1 levels and the formation of a compromised splice-altered U2 snRNP.

