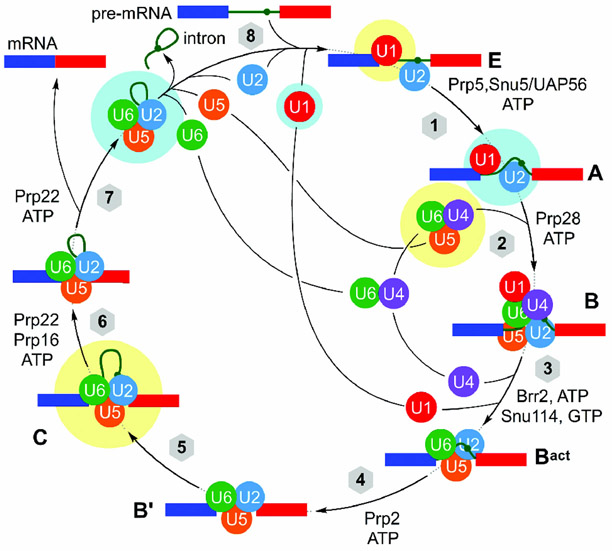
Figure 15.
The mechanism of splicing, depicting complexes A, B, Bact, B’, C, and E. A detailed structural understanding of each of the eight steps in this process is slowly being revealed using a combination of cryo-EM and X-ray crystallography with recent human or yeast structures, as noted by highlighting in yellow (human) and cyan (yeast).

