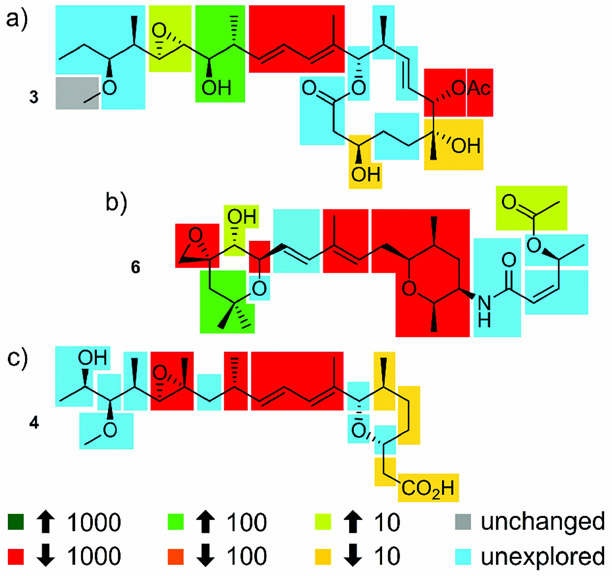
Figure 5.
Structure--activity relationships (SARs) identified through synthetic and semisynthetic studies. These maps were developed using data published up to January 2017 and represent findings from in vitro cytotoxicity assays, not direct comparisons of the effect on RNA splicing. Data has been presented to show the optimal analogues for each position, as given by fold increase (up arrow) or decrease (down arrow) in activity. Unchanged denotes substitutions that have been shown to have little effect, while unexplored represents regions that lack sufficient data for assignment.

