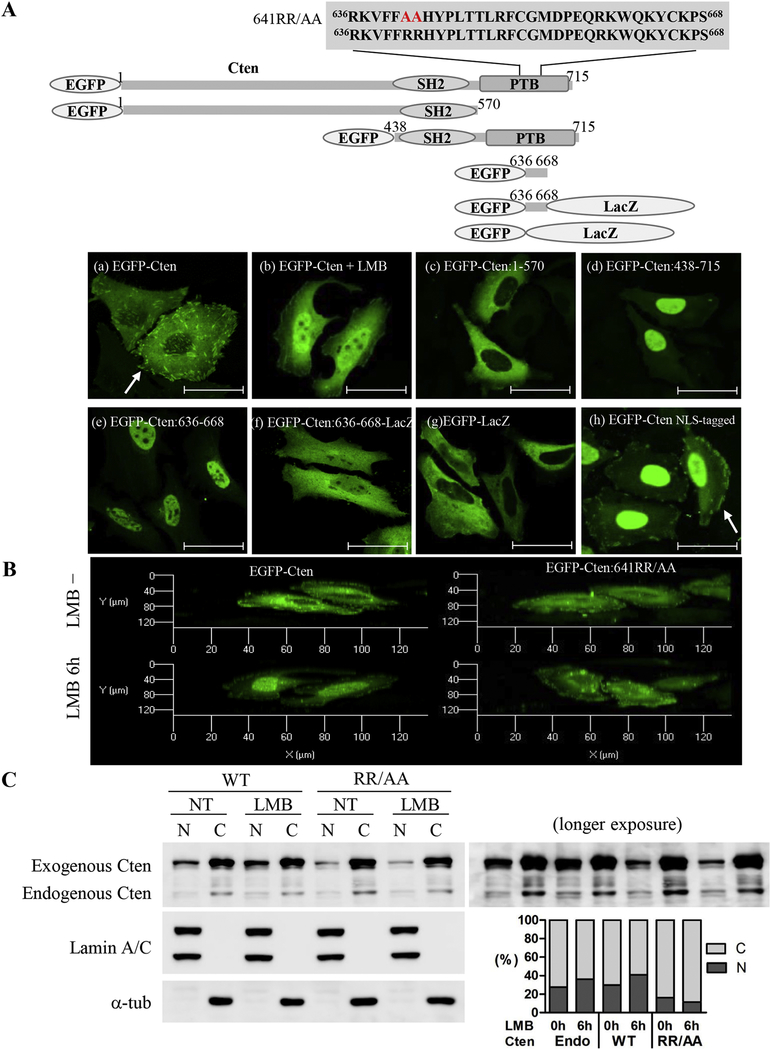
Figure 2. Identification of nuclear localization sequence in Cten.

(A) Top: Schematic representation of EGFP-Cten constructs used to identify Cten’s nuclear localization sequence. The predicted NLS sequence located in the fragment 636 to 668 was shown. Bottom: HeLa cells transiently transfected with indicated constructs were fixed and visualized by confocal laser microscopy. Scale bar, 50 μm. Arrows indicate focal adhesion sites. (B) Overhead 3D reconstruction of confocal Z-stack images demonstrating the nuclear localization of Cten. HeLa cells were transiently transfected with EGFP-Cten or EGFP-Cten641RR/AA and then treated with or without 20 ng/mL LMB for 6 hours. The 3D Confocal immunofluorescence images in HeLa cells were obtained from a stack of 5–6 consecutive images (interval thickness=1 μm) centered on the middle of the nucleus. (C) HeLa cells transiently transfected with EGFP-Cten or EGFP-Cten641RR/AA were treated with or without 20 ng/mL LMB for 6 hours. Left: Equal amounts of nuclear and cytoplasmic fractions (2.5μg) were analyzed by immunoblotting using antibodies against Cten, lamin A/C, or a-tubulin. Right: Quantification of band intensities from nuclear and cytoplasmic fractions of endogenous or exogenous Cten measured by Cten immunoblotting.
