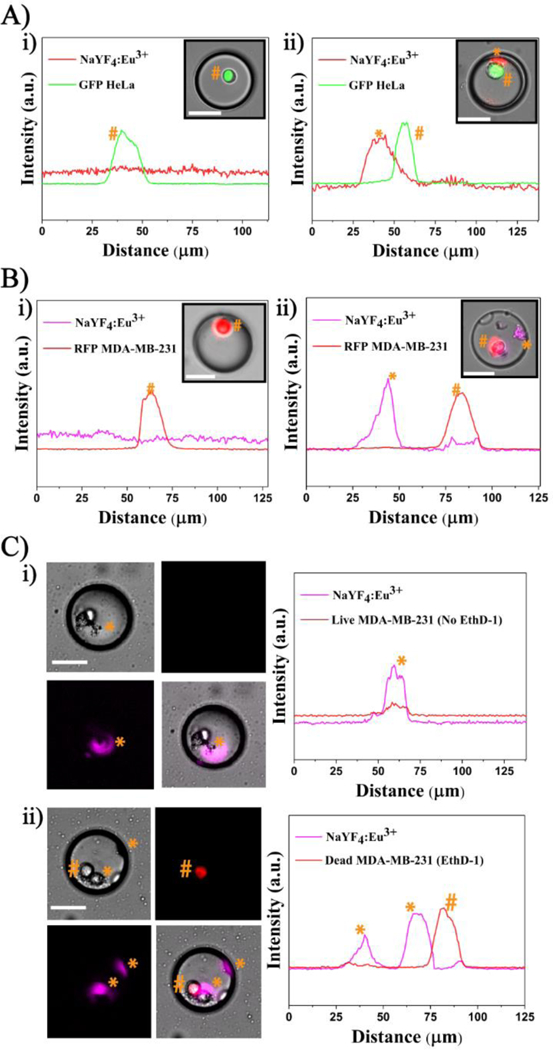
Fig. 7.

Spectral independence of Eu3+-doped NP with common fluorescent markers: (A) GFP and (B) RFP. Line scan across droplets showing a significant signal from the GFP-HeLa cell in (A)-i; spectral independence of Eu3+ NP with GFP- HeLa cell in (A)-ii. RFP MDA-MB-231 cell in (B)-i; RFP MDA-MB-231 cell with Eu3+ NP in (B)-ii. (C) A population of live and dead MDA-MB-231 cells co-encapsulated with Eu3+-doped NP. Line scan across a droplet having a live cell with NP in (C)-i and dead cell with NP in (C)-ii. * denotes NP and # denotes cell and their corresponding signal intensities across the droplet. Note: Eu3+ NPs are depicted in magenta to distinguish from RFP and dead stain (red). Scale bar is 35
