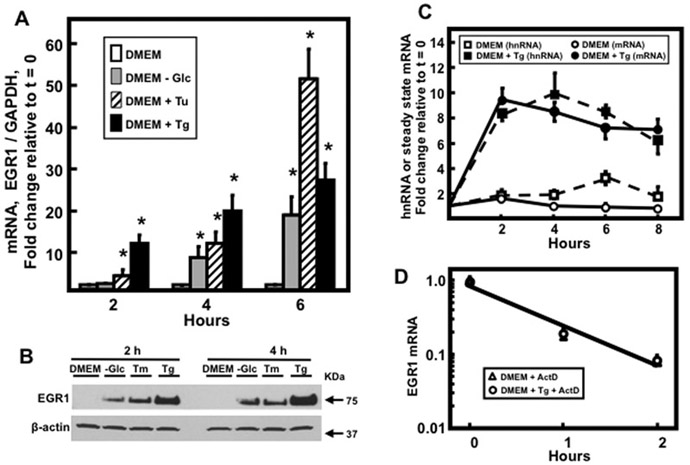
Fig. 1.
Regulation of EGR1 expression in response to ER stress. (Panel A) HepG2 human HCC cells were incubated in complete DMEM or DMEM lacking glucose, DMEM + 6 μM Tu, or DMEM + 50 nM Tg for the indicated time. EGR1 steady state mRNA content was assayed by RT-qPCR. GAPDH mRNA, which is not affected by ER stress, was used as an internal control and data shown are the means ± SD of at least triplicate samples within an experiment. The results shown are representative of multiple experiments. An asterisk indicates that the value is significantly different (p ≤ 0.05) from the DMEM control. (Panel B) HepG2 cells were incubated in complete DMEM or DMEM lacking glucose, DMEM + 6 μM Tu, or DMEM + 50 nM Tg for 2 and 4 hr and then EGR1 protein was measured in whole cell extracts by immunoblotting. The protein level of β-actin was used as the control. (Panel C) HepG2 human HCC cells were incubated in complete DMEM or DMEM + 50 nM Tg for the times indicated and EGR1 transcription activity, as measured by hnRNA, or steady state mRNA were assayed by RT-qPCR. (Panel D) The cells were incubated in DMEM + 50 nM Tg for 8 h and then transferred to complete DMEM or DMEM + Tg, which contained 5 μM actinomycin D (ActD), for an additional 2 h. EGR1 mRNA was measured by RT-qPCR and data were plotted as the logarithm of mRNA content versus time following incubation in ActD-containing medium. GAPDH mRNA, which is not affected by ER stress, was used as an internal control and results shown are the means ± SD of at least triplicate samples within an experiment. The results shown are representative of multiple experiments.

