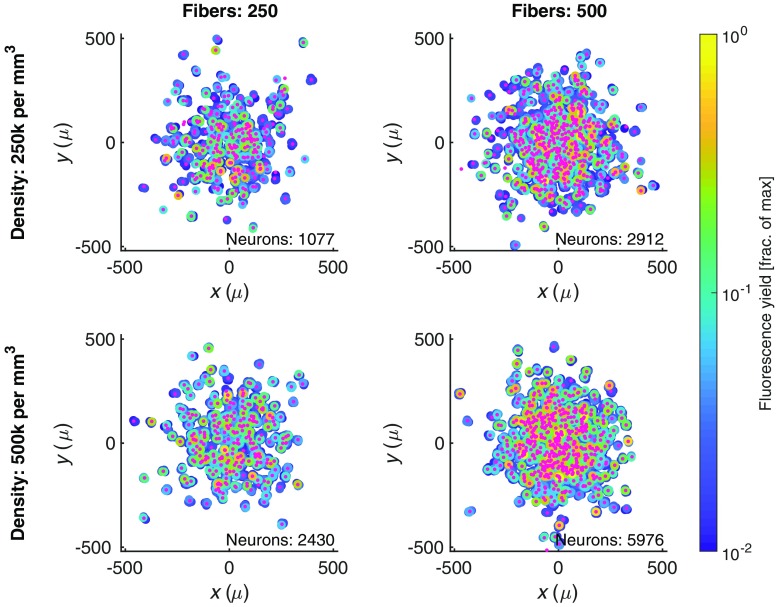
Fig. 3.
The neural population we expect to interface with through a bundle of splayed optical microfibers. The spatial distribution of fibers (small pink dots) is based on the bivariate normal distribution seen in histology slices,15 and is shown in relation to the neurons (large circles) that are contributing fluorescence to the collected signal above a 1% threshold. Neurons are colored based on their fluorescence signal contribution to the fiber normalized by the maximum fluorescence signal that would be recorded when a cell is immediately under a fiber. Columns show two distinct fiber counts (with same splay parameter, ); rows show two distinct cell densities.

