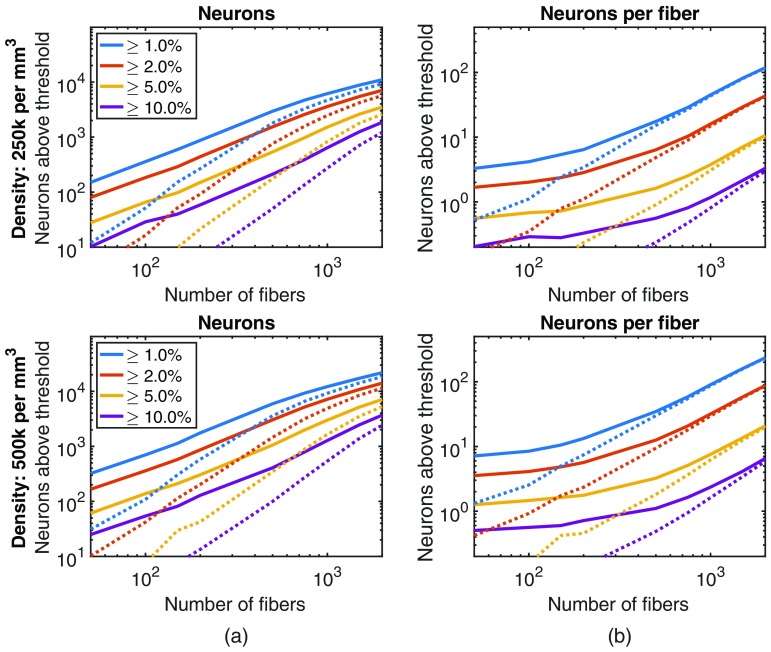
Fig. 4.
By increasing the number of fibers, while holding the splay diameter constant (), the bundle can interface with more neurons. The visibility of a neuron is calculated based on their fluorescent contribution to a fiber normalized by the maximum fluorescence signal that would be recorded when a cell is immediately under a fiber. Each point is the average of five randomly generated fiber implant distributions. (a) The solid lines plot how many neurons are clearly visible (given different thresholds, represented as different color lines) to at least one fiber in the bundle. The dotted lines plot how many neurons are clearly visible to two or more fibers. (b) How many neurons are visible to a single fiber in the bundle. As the number of fibers increases, the excitation power increases and more neurons become visible.

