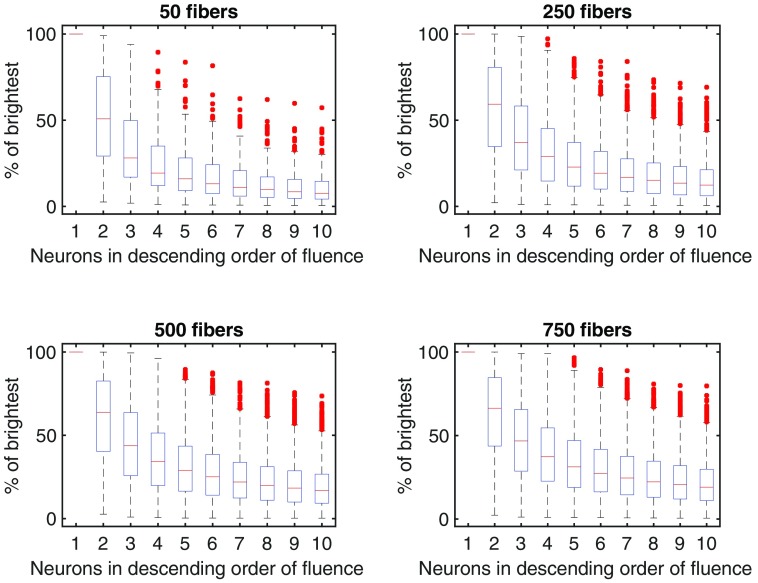
Fig. 5.
The contribution of individual neurons to the signal recorded through a single fiber. Values are normalized to the first (brightest) neuron visible to the fiber. Increasing the number of fibers does not substantially change the distribution, but delivers more light, which increases the brightness of the neurons further from the tip of the fiber. Each fiber captures fluorescence from a number of neurons, with an exponential drop off in the relative contribution of neurons. Each plot represents the average distribution of neural contributions for each fiber, averaged across fibers, and across five randomly sampled distributions of fibers. The four subfigures show increasing numbers of fibers, with a constant amount of splay ().

