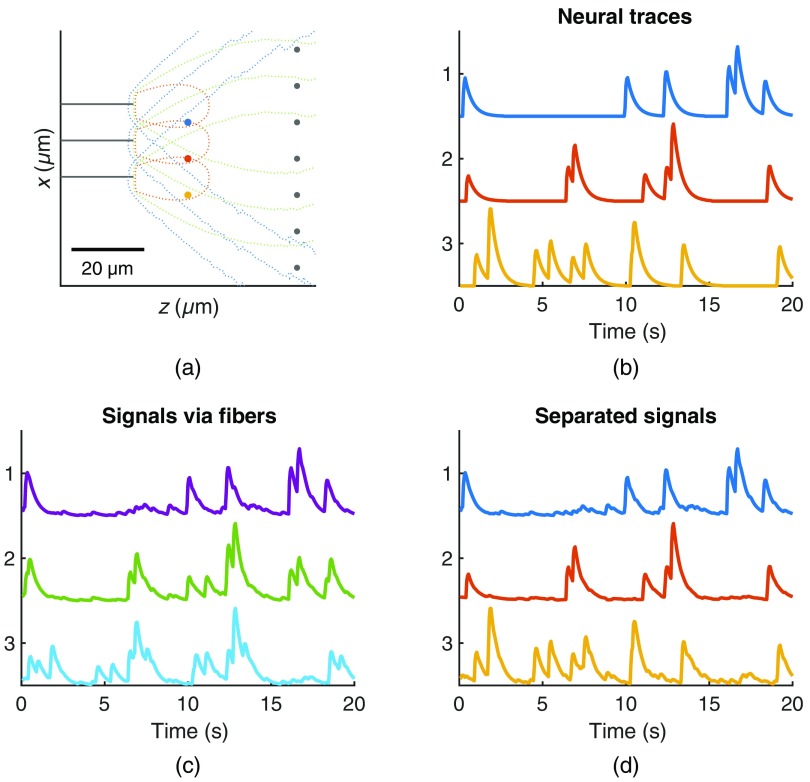
Fig. 7.
Simplified model used to exemplify the source separation process. (a) A simple 2-D configuration of fibers and neurons to demonstrate the source separation technique. Three fibers are shown in gray, each with contours representing their sensitivity profile. Three neurons (blue, red, and yellow) are positioned near the fibers while many neurons are distributed further from the fibers (creating background fluorescence). (b) Traces for the three neurons of interest generated as a random Bernoulli process convolved with a GCaMP6f waveform. (c) The signals recorded from the three fibers, representing a linear mixing of all the neurons based on the relative sensitivity. (d) The three outputs of the source separation process, sorted to most closely match the original neural traces.

