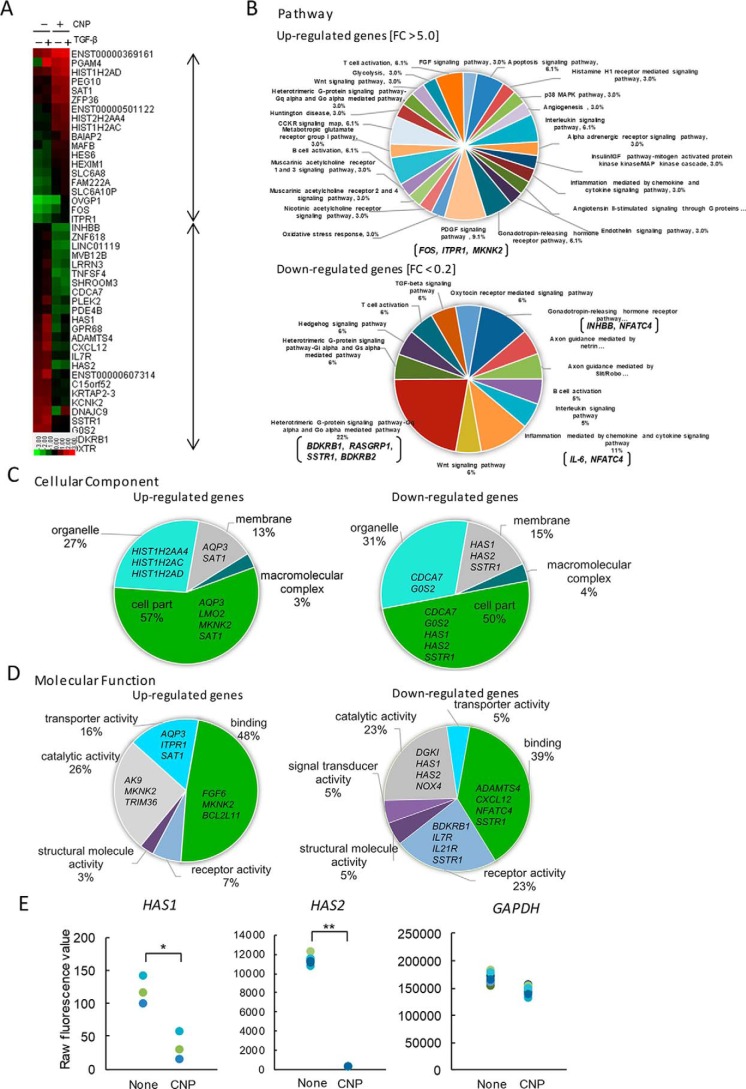
Figure 2.
Gene expression analysis. NB1RGB cells were cultured for 16 h and treated with CNP or not. After 1 h, cells were treated with TGFβ(Tβ) or not and cultured for an additional 6 h. Next, total RNA from CNP-treated and untreated cells was extracted and subjected to cDNA microarray analysis using a Human Gene Expression 4 × 44K microarray chip (Agilent Technologies). A, heatmap of up-regulated genes (39 genes; -fold change, >5.0) and down-regulated genes (53 genes, -fold change <0.2) after CNP treatment in the presence or absence of TGFβ. The heatmap was constructed using normalized values for each sample and Treeview software. The corresponding gene names are annotated on the right. B–D, gene ontology analyses using the Panther classification system. The up-regulated and/or down-regulated genes were classified using PANTHER gene list analysis (www.pantherdb.org/). (Please note that the JBC is not responsible for the long-term archiving and maintenance of this site or any other third party–hosted site.) Shown are a pie chart indicating the percentages of genes classified into each molecular pathway (B), cellular component (C), and molecular function (D). E, differential gene expression between CNP-treated cells and untreated cells. Raw fluorescence values obtained by scanning were utilized for comparison of gene expression of HAS2 and GAPDH. *, p < 0.01; **, p < 0.001; significant difference.

