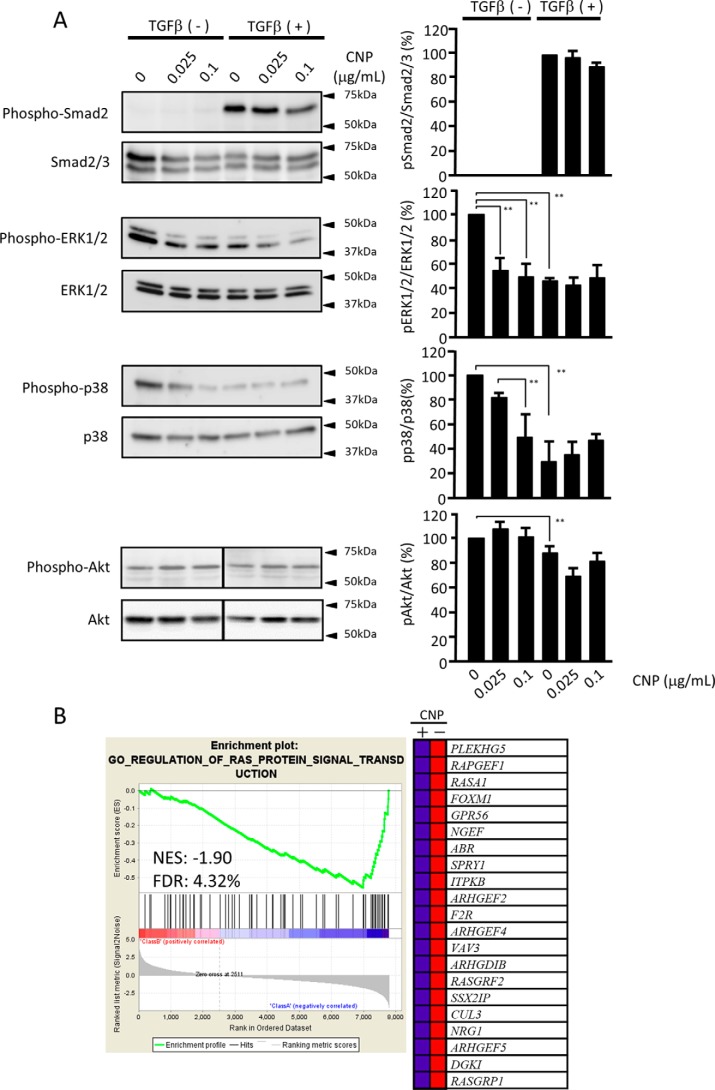
Figure 6.
Signal transduction pathways affected by CNP. A, immunoblot panels for Smad2/3, ERK1/2, p38 MAPK, and Akt together with their phosphorylation forms. The lines in the pAkt and tAkt panels indicate a splice where the same image was reordered so that the data are presented in the same order as the other panels in this figure. The right panels are quantification data of their band density. Each experiment was performed five times with essentially the same results. Statistical analysis was performed using the results of all experiments. B, suppression of RAS-ERK signaling by CNP. The GSEA was conducted using GSEA software v2.2.4 and the Molecular Signatures Database (Broad Institute). All raw data were formatted and applied to all Gene Ontology (GO) gene sets (C5). A representative GSEA enrichment plot and corresponding heatmap image of the indicated gene set are shown for CNP-treated and untreated cells, respectively. Genes contributing to the enrichment are shown in rows, and the samples are shown in columns on the heatmap. Expression is shown as a gradient from high (red) to low (blue). FDR, false discovery rate; NES, normalized enrichment score.

