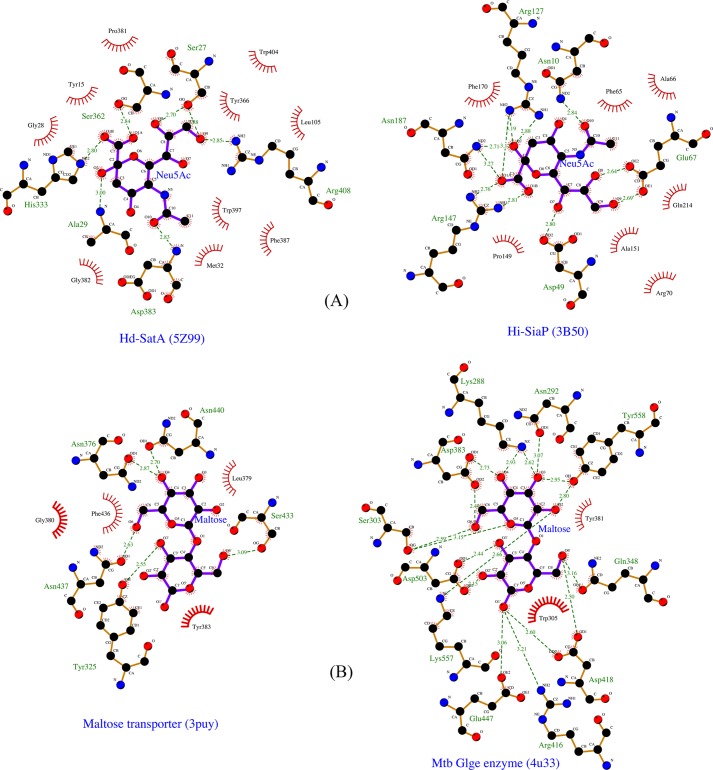
Figure 5.
Ligplot diagrams showing the ligands and its interacting residues different proteins. A, Ligplot representation of the binding pocket of Hd-SatA and H. influenzae SiaP in the presence of their ligand Neu5Ac. B, Ligplot representation of maltose transporter and bacterial maltosyltransferase in the presence of their ligand maltose. Ligands are represented in purple color. Carbon, nitrogen, and oxygen are represented in black, blue, and red, respectively. The residues with red spikes that are oriented toward the ligand represent hydrophobic interactions.

