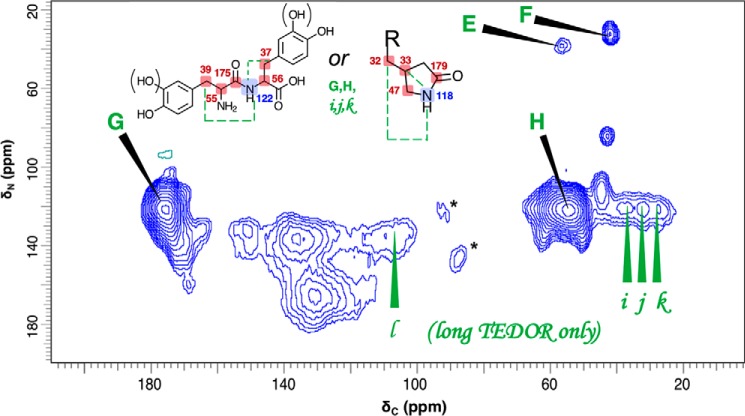
Figure 5.
Contour plot of 2D 13C–15N ZF-TEDOR long-recoupling results on a sample from 1.5-day cell-free melanization with a l-[U-13C,15N]tyrosine precursor. The experiment required 25 h on a Bruker AV3 DNP spectrometer operating at a 1H frequency of 600 MHz, temperature of 100 K, magic-angle spinning frequency of 12.5000 ± 0.0005 kHz, and TEDOR evolution period of 2.88 ms corresponding to 1- and 2–3 bond pairwise 13C–15N correlations. Spinning sidebands that are incidental to the structural analysis are denoted by asterisk symbols. The 13C–15N cross-peaks designated by uppercase letters are identified provisionally with directly bound C–N pairs within the illustrated chemical structures; pairwise proximities that were observed exclusively with the longer coherence transfer period are denoted with lowercase letters. These assignments draw on previously proposed melanin structural constituents (11, 13, 16, 41) and the corresponding ACD-predicted chemical shifts predicted with error limits of 3–10 ppm and shown for 13C (red) and 15N (blue).

