Figure 1.
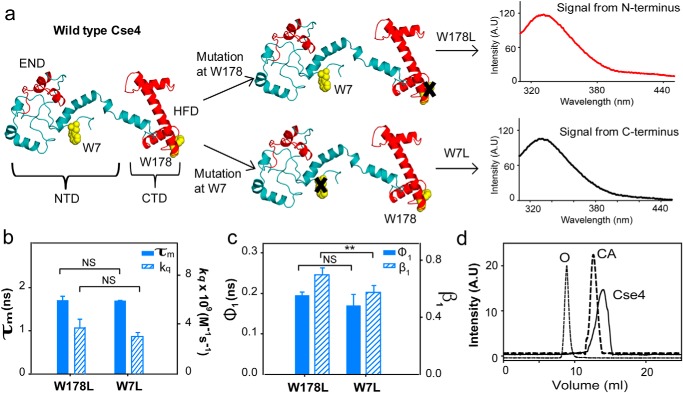
CENP-ACse4 N-terminal tail is restricted. a, strategy for the fluorescence assay to create single Trp mutants in Cse4 to study the two domains individually. The END and HFD are highlighted in red. NTD and CTD correspond to residues 1–129 and 130–229, respectively. Note that according to a proposed model, Trp-7 is in a disordered region, implying that it is expected to have more conformational freedom than Trp-178. b, comparison of fluorescence lifetimes (filled bars) and solvent accessibility (striped bars) of the two domains. c, conformational flexibility of the two Trp residues in the native state. Filled bars represent φ1, and the striped bars represent β1. d, gel-filtration profile of folded Cse4 protein (solid line). The dotted lines represent the protein markers ovalbumin (O; 44 kDa) and carbonic anhydrase (CA; 29 kDa). The Cse4 structure represented in all figures is the modeled structure by Bloom et al. (Protein Data Bank (PDB) code 2FSC; Ref. 21) and is rendered in PyMOL 1.8. The statistical significance was calculated by one-way analysis of variance: **, p < 0.01; NS (not significant), p > 0.05; error bars represent S.D. A.U., arbitrary units.

